Polkadot, Solana, Bitcoin Cash Price Analysis: 9 December

The broader market continued to flash a bearish outlook as the RSI of altcoins like Polkadot, Solana, and Bitcoin Cash strived to cross the midline. Furthermore, the near-term technicals for all these cryptos preferred the bears and correlated with the broader trend.
Polkadot (DOT)
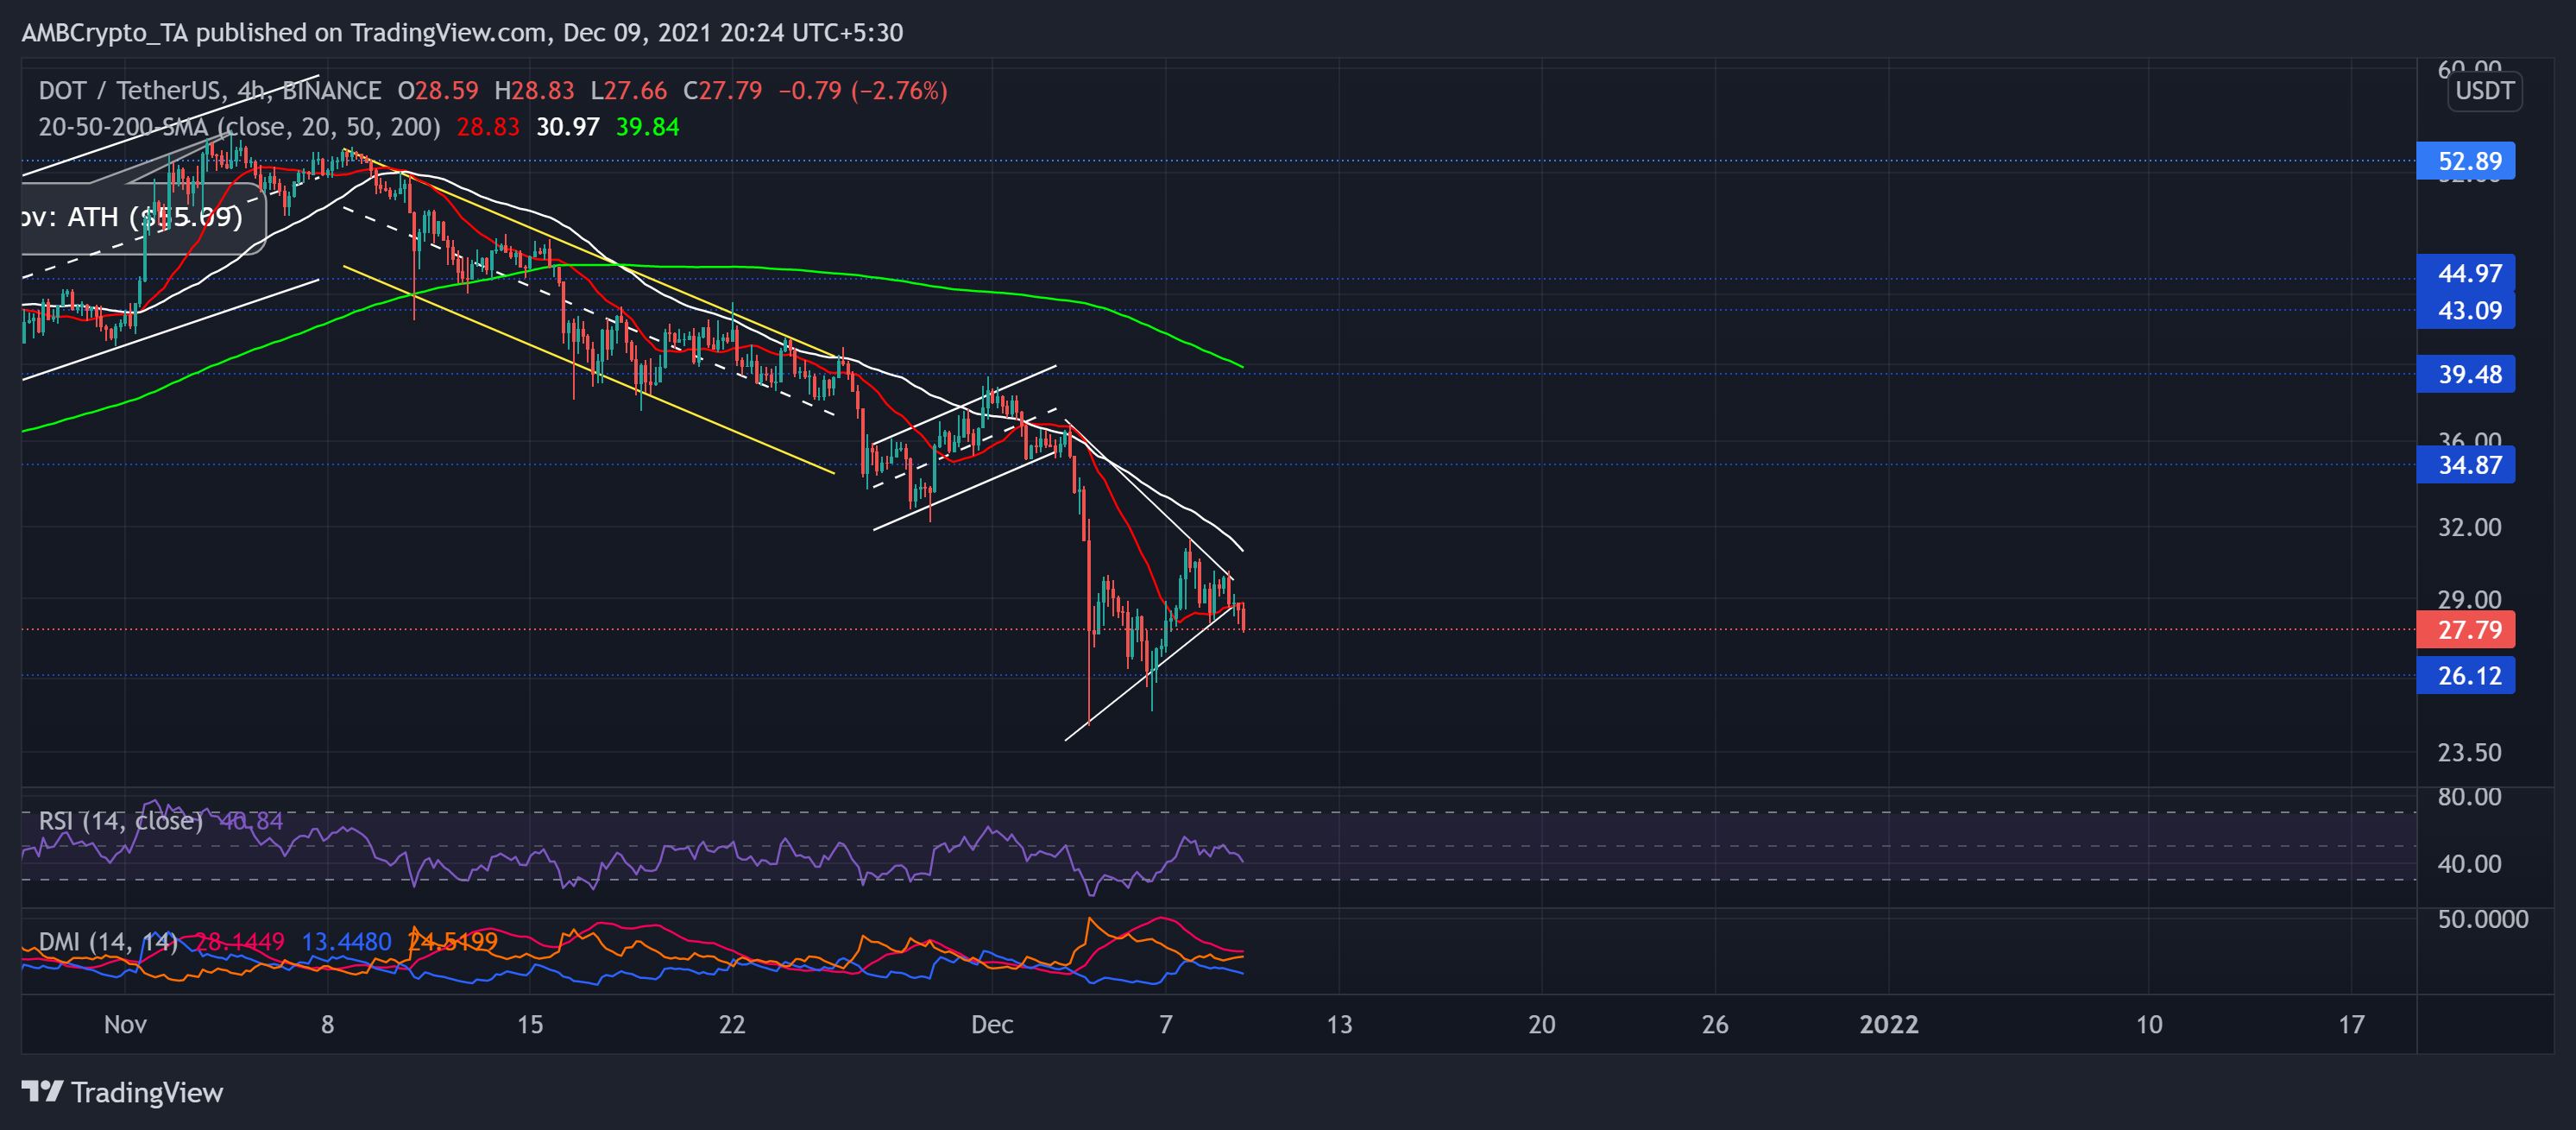
DOT bears accelerated their bearish swing over the past month after poking its ATH on 4 November. It downturned after forming a descending channel (yellow). Consequently, the alt saw an atrocious 46.6% 30-day and 22.3% weekly decline in its value.
After a down-channel breakout, the bulls tried to uphold the $34.87 eight-week resistance, but their rally was short-lived as the bears breached it after a steep plunge on 3 December. This decline pushed the price action below the 4-hour 20-50-200 SMA to poke its 12-week low at $24.3.
Over the past five days, DOT formed a symmetrical triangle after flashing bearish tendencies. At press time, the alt traded at $27.79.
On the 4-hour timeframe, DOT’s RSI practically struggled to breach the midline since last month, depicting a powerful bearish vigor. Further, the DMI reaffirmed the previous analysis by choosing the sellers.
Solana (SOL)
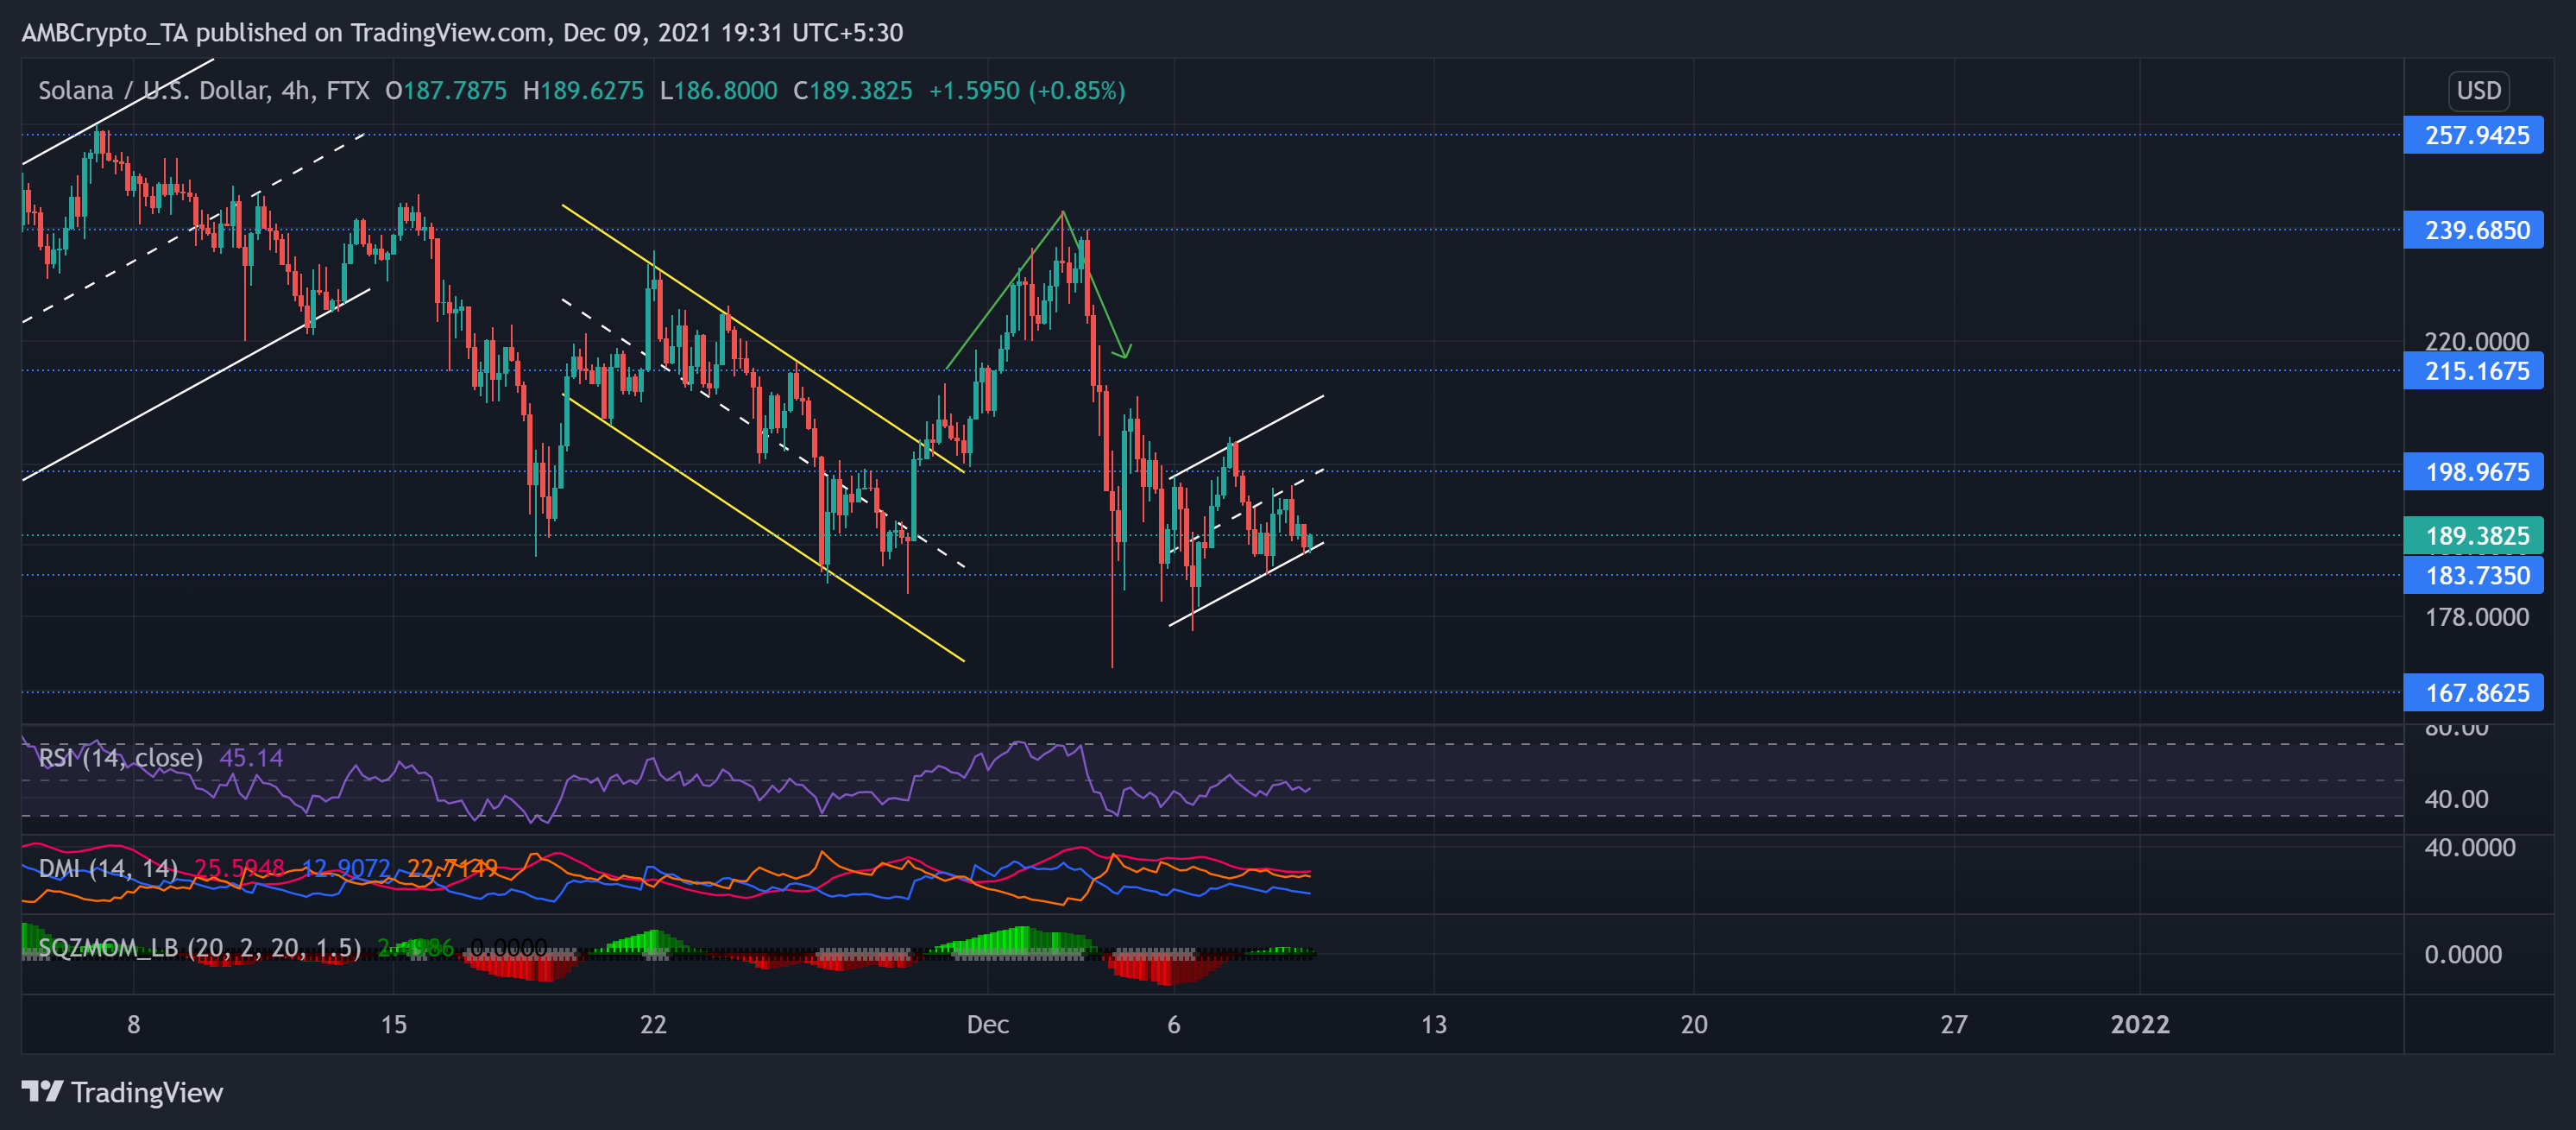
Like DOT, SOL bears increased the selling pressure in the last month as the alt touched its ATH on 6 November. The alt plummeted by marking a down-channel (yellow). Then, after losing nearly one-third of its value, the price poked its six-week low on 3 December.
However, the bulls were quick to revert and ensure the six-week support at the $183-mark. Accordingly, the price action marked an up-channel as the bulls endeavored to retest the $198.9- resistance.
At press time, SOL traded at $189.38. The RSI depicted a slight bearish preference and could not cross the midline in the past six days. Further, the DMI displayed momentum favoring the bears. Nevertheless, the Squeeze Momentum Indicator exhibited black dots, indicating a possible squeeze phase with low near-term volatility.
Bitcoin Cash (BCH)
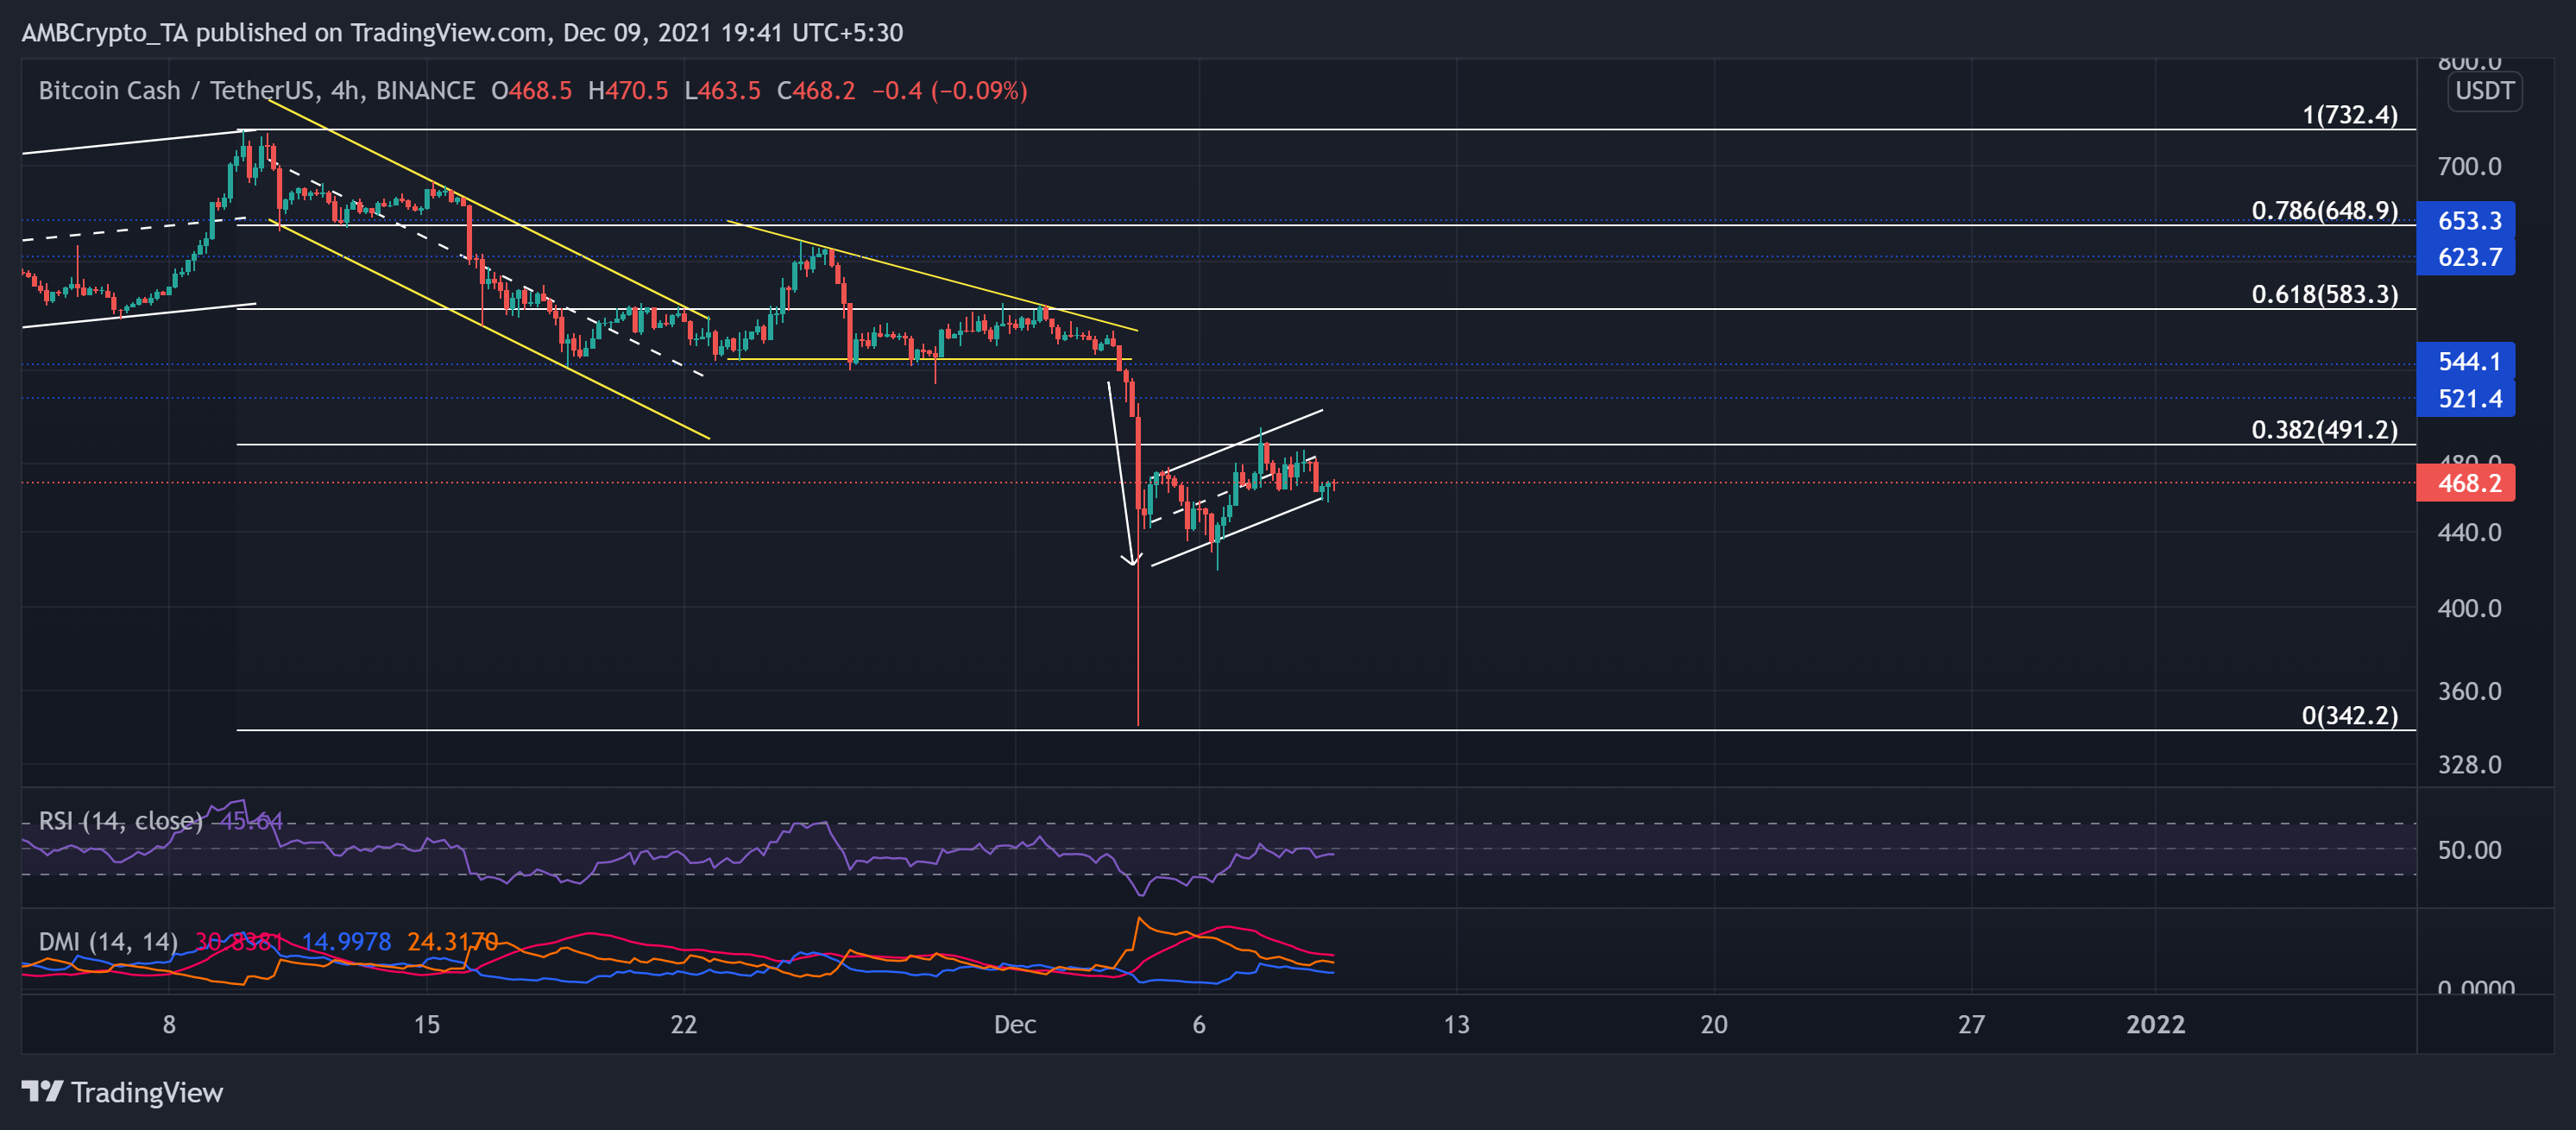
While retesting the 38.2% Fibonacci level, BCH formed a bearish flag pattern since the past day. After an impressive October run, the alt marked lower lows in a descending channel (yellow). After a 13.7% down-channel breakout, BCH continually fell and formed a descending triangle (yellow) in its 4-hour chart.
This downturn strengthened the descending triangle breakout as the alt touched its 11-month low on 3 December. At press time, BCH traded at $468.2.
The RSI showed decent revival signs but struggled to stay above the midline since 26 November. Also, the DMI hinted at a slight bearish preference. Now, unless the bulls gather increased volumes, the immediate 38.2% Fibonacci resistance will stay strong.


