Polkadot, Stellar Lumens, Uniswap Price Analysis: 24 May

Polkadot’s rally could peak at $30, something that would highlight a jump of 100% in just two days. Meanwhile, Stellar Lumens and Uniswap each surged by 40% and battled to take the lead in the mid-cap alt race.
Polkadot [DOT]
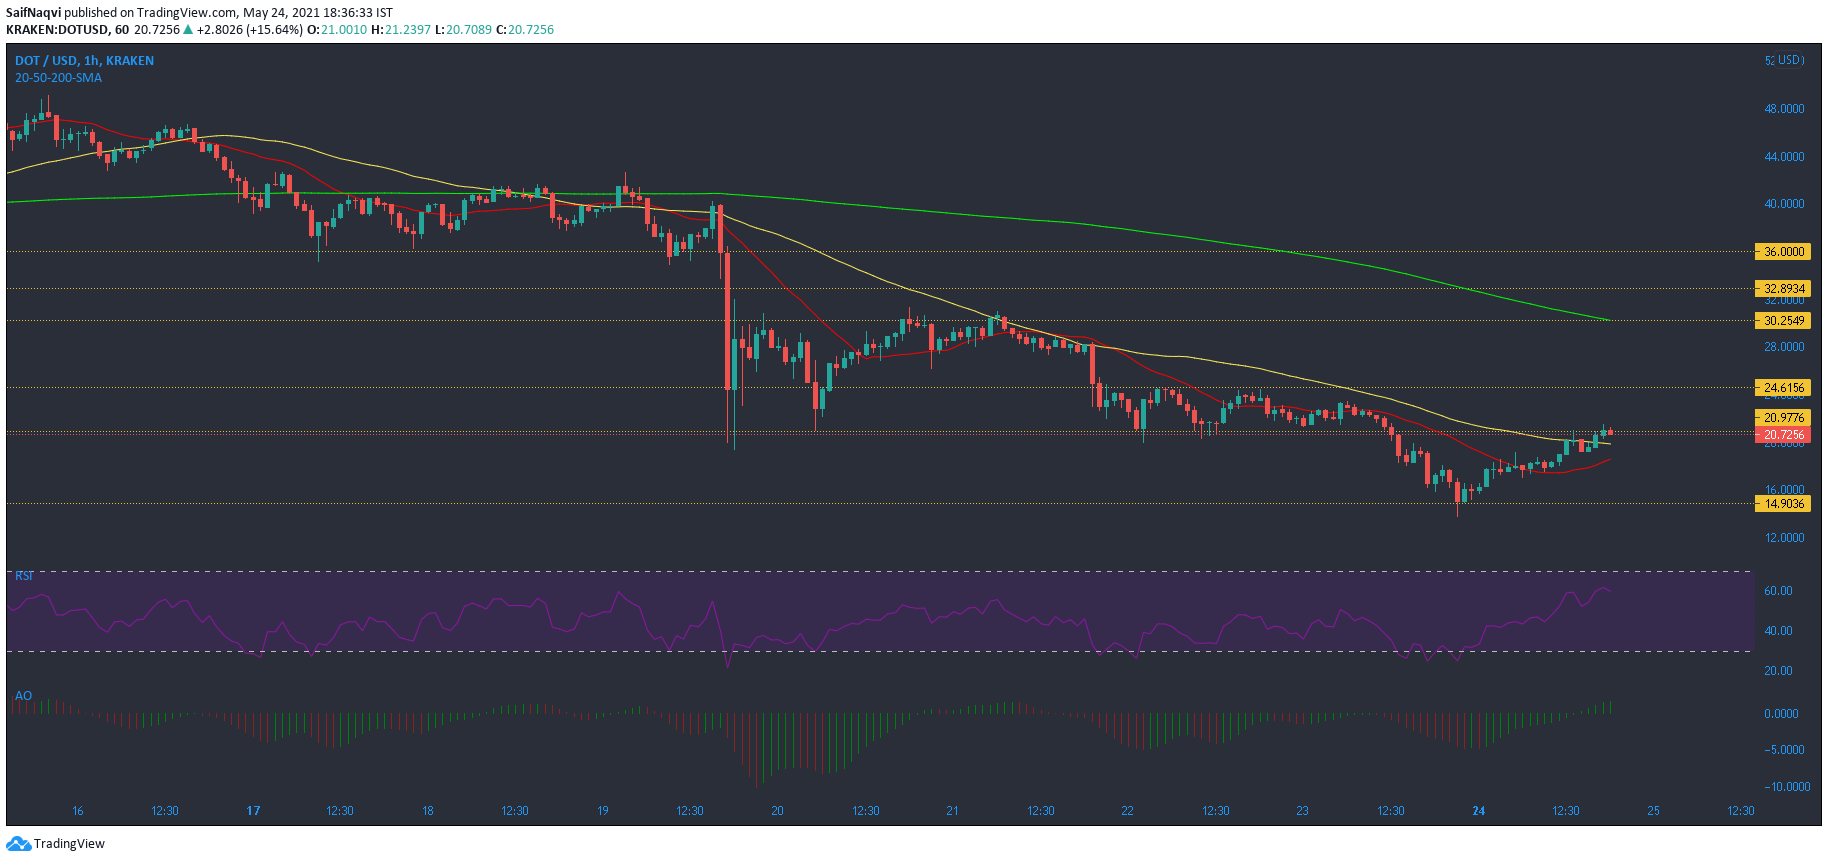
Polkadot saw northbound action after the bulls defended a breakdown from the $14.9-support level. Now above its 50-SMA (yellow) on the hourly chart, short-term gains could be seen up to the $24.6-resistance. If Bitcoin manages to clear past $40k today, DOT might even see gains above $30-resistance and its 200-SMA (green). Overall, this would result in a price hike of 100% in only two days.
The Awesome Oscillator was above the half-line for the first time since May 20. The RSI was yet to touch the overbought zone and chances of a pullback were slim over the coming sessions.
Stellar Lumens [XLM]
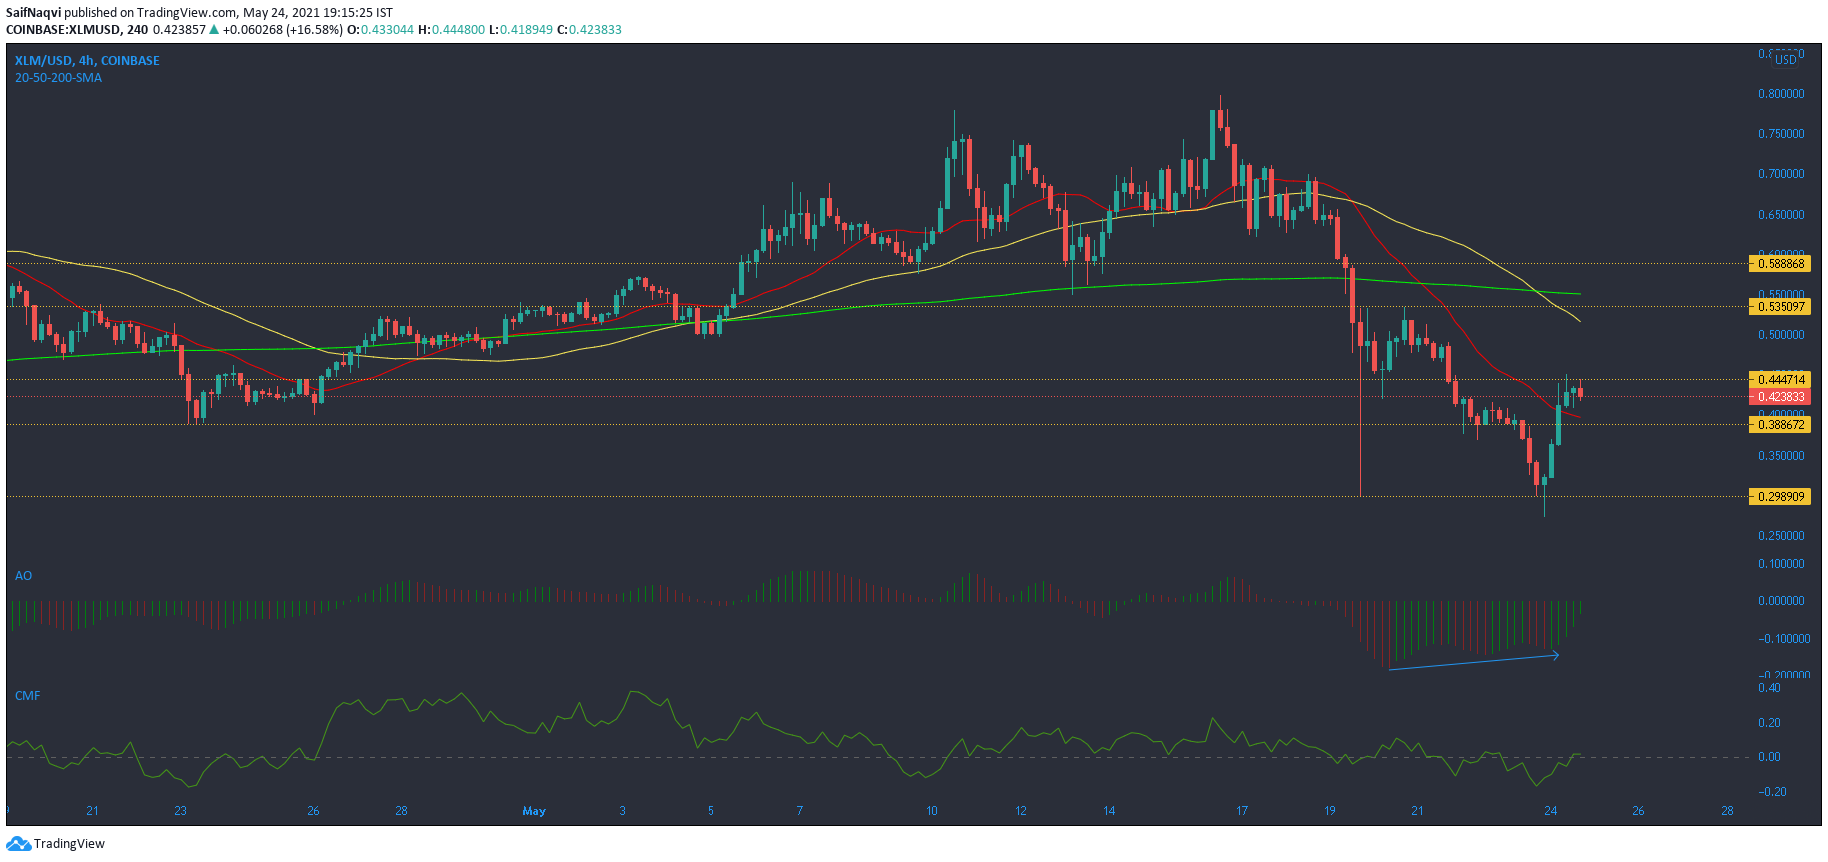
Stellar Lumens was one of the frontrunners among the top 15 coins by market cap, up by 41% over the last 24 hours. On the 4-hour timeframe, resistance in the form of $0.44 presented the first roadblock for XLM to achieve an even higher surge in value. A breakout above the aforementioned level could extend gains all the way towards $0.53 – An area that saw confluence between the 50-SMA (yellow) and 200-SMA (green). In case of a pullback, the recently overturned resistance level at $0.388 could provide some support.
A bullish twin peak setup on the Awesome Oscillator could see it move above the half-line – An indication of incoming buying pressure. Even capital inflows outweighed outflows as the CMF traded just above the half-mark.
Uniswap [UNI]
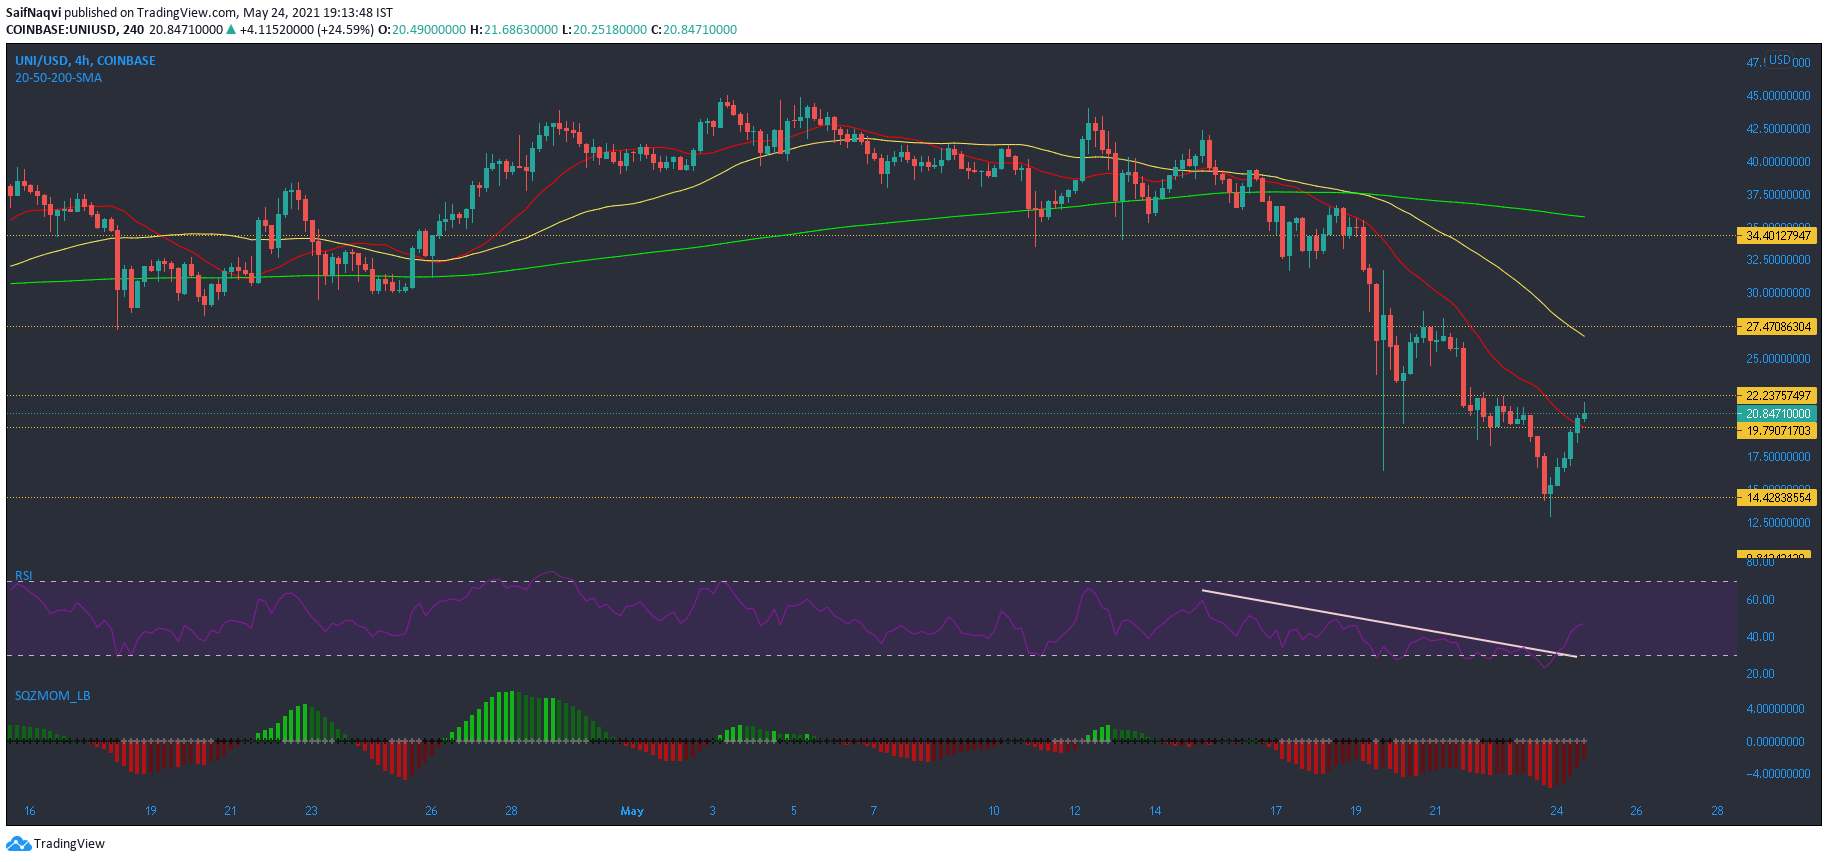
Uniswap also maintained an edge over most mid-cap alts as buyers heavily favored the decentralized exchanges’ native cryptocurrency. In fact, gains of 42% even trumped those of its counterpart XLM. On the 4-hour chart, UNI climbed above its 20-SMA (red) and headed towards the $22.23-resistance.
If bulls manage to clear this upper ceiling, another 23% rally was possible till $27.4 and the 50-SMA (yellow). If a breakout is denied, some rangebound movement above $20 can be expected before the next leg upwards.
The RSI broke above its sloping trendline as the bulls enforced a shift or market conditions. A rise above 50 would highlight more bullish control. Squeeze Momentum Indicator moved towards the halfway mark and successive green bars would point to an extended rally.