Polkadot, Synthetix, Uniswap Price Analysis: 04 February

Polkadot broke out past a range it was trading in over the past few weeks and targeted the $23.6 mark. Synthetix dipped to find support at $16.6 and climbed higher, while Uniswap showed a bearish divergence across multiple timeframes after its strong performance since November.
Polkadot [DOT]
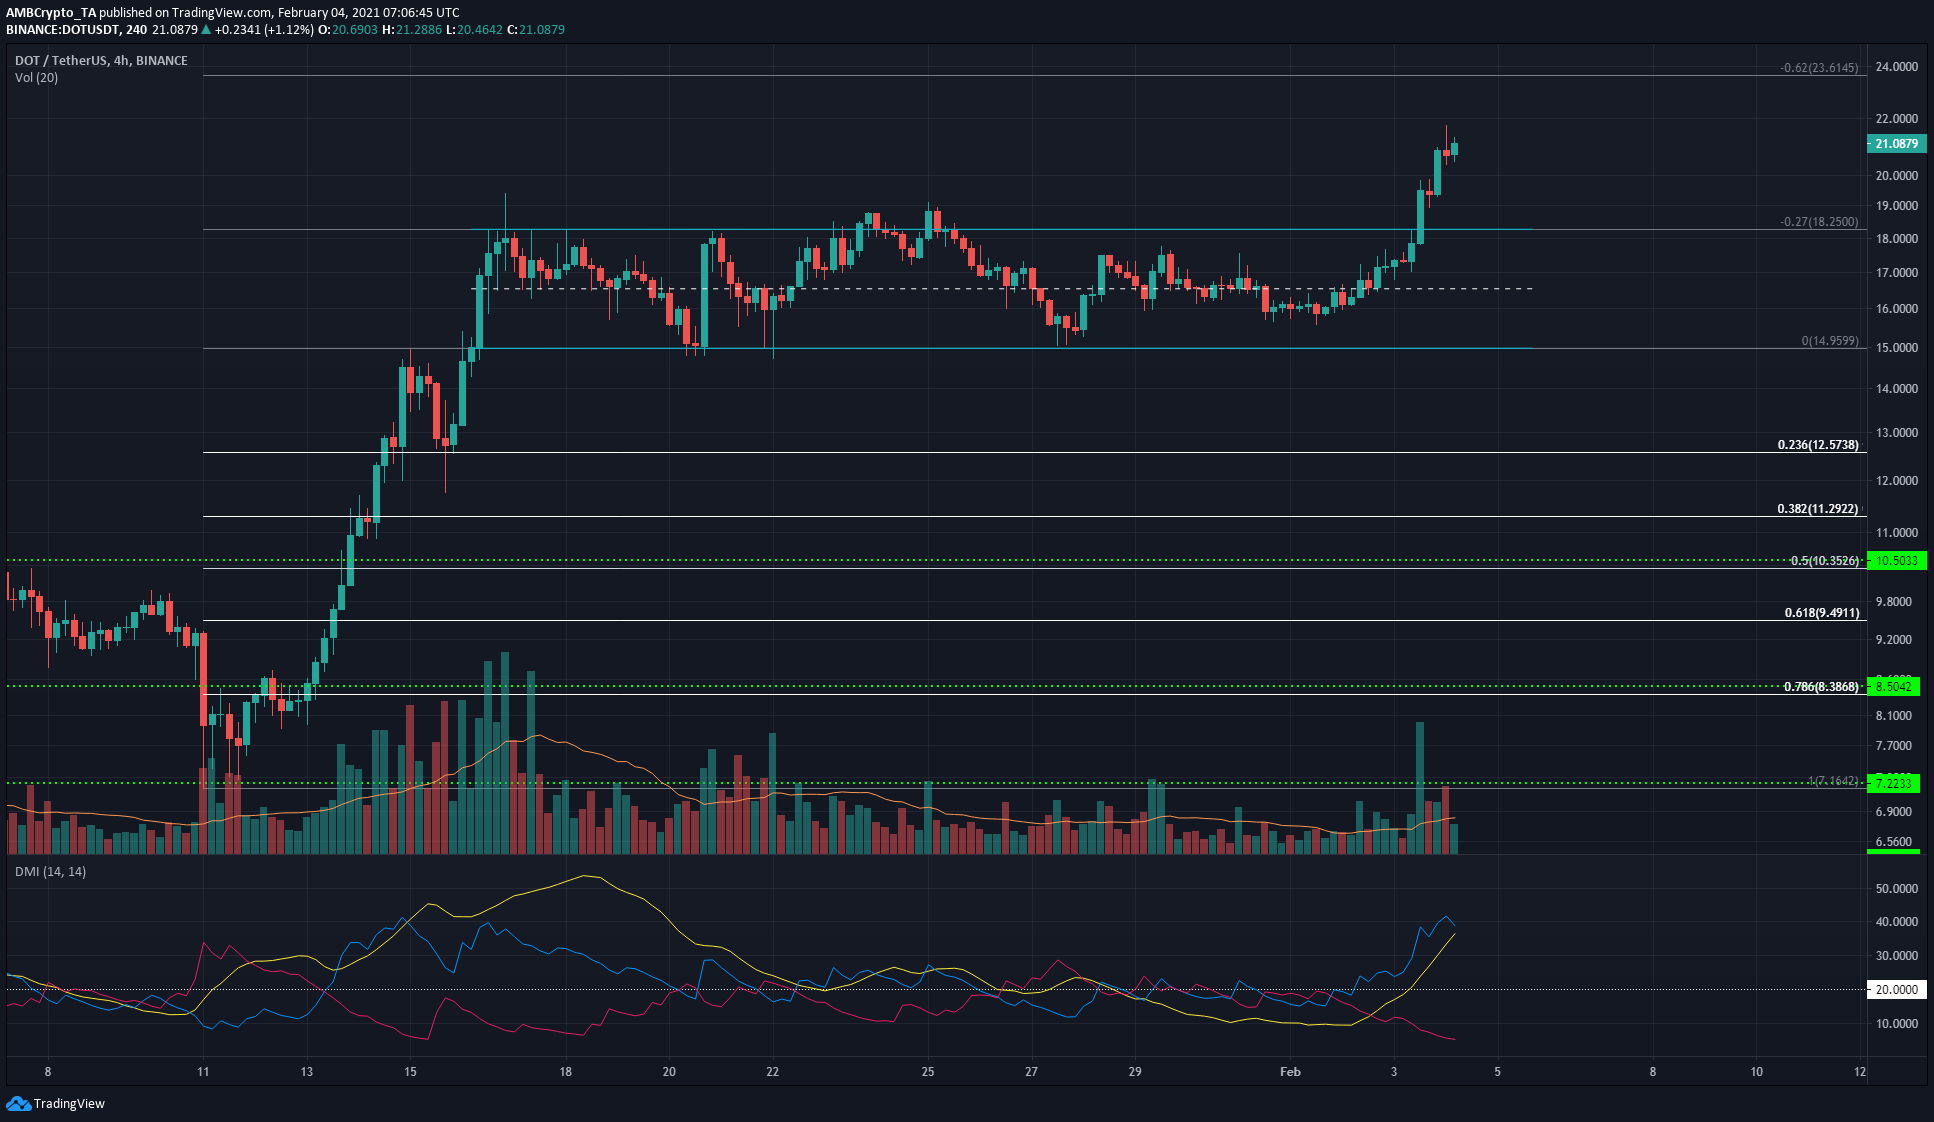
Polkadot was trading within the range from $14.95 to $18.25 (cyan) since mid-January and saw a breakout past the range in the past few hours.
The Directional Movement Index signaled a strong uptrend which was initiated when DOT was just beneath $18 and continued to signal a bullish trend in progress as the ADX (yellow) was above the 20 value.
Trading volume upon breakout was also strong, and DOT bulls can push the price to the 62% extension of the surge from $7.1 last month. This projected the $23.6 mark as a target, where some selling in the form of profit-taking can be expected to occur.
Synthetix [SNX]
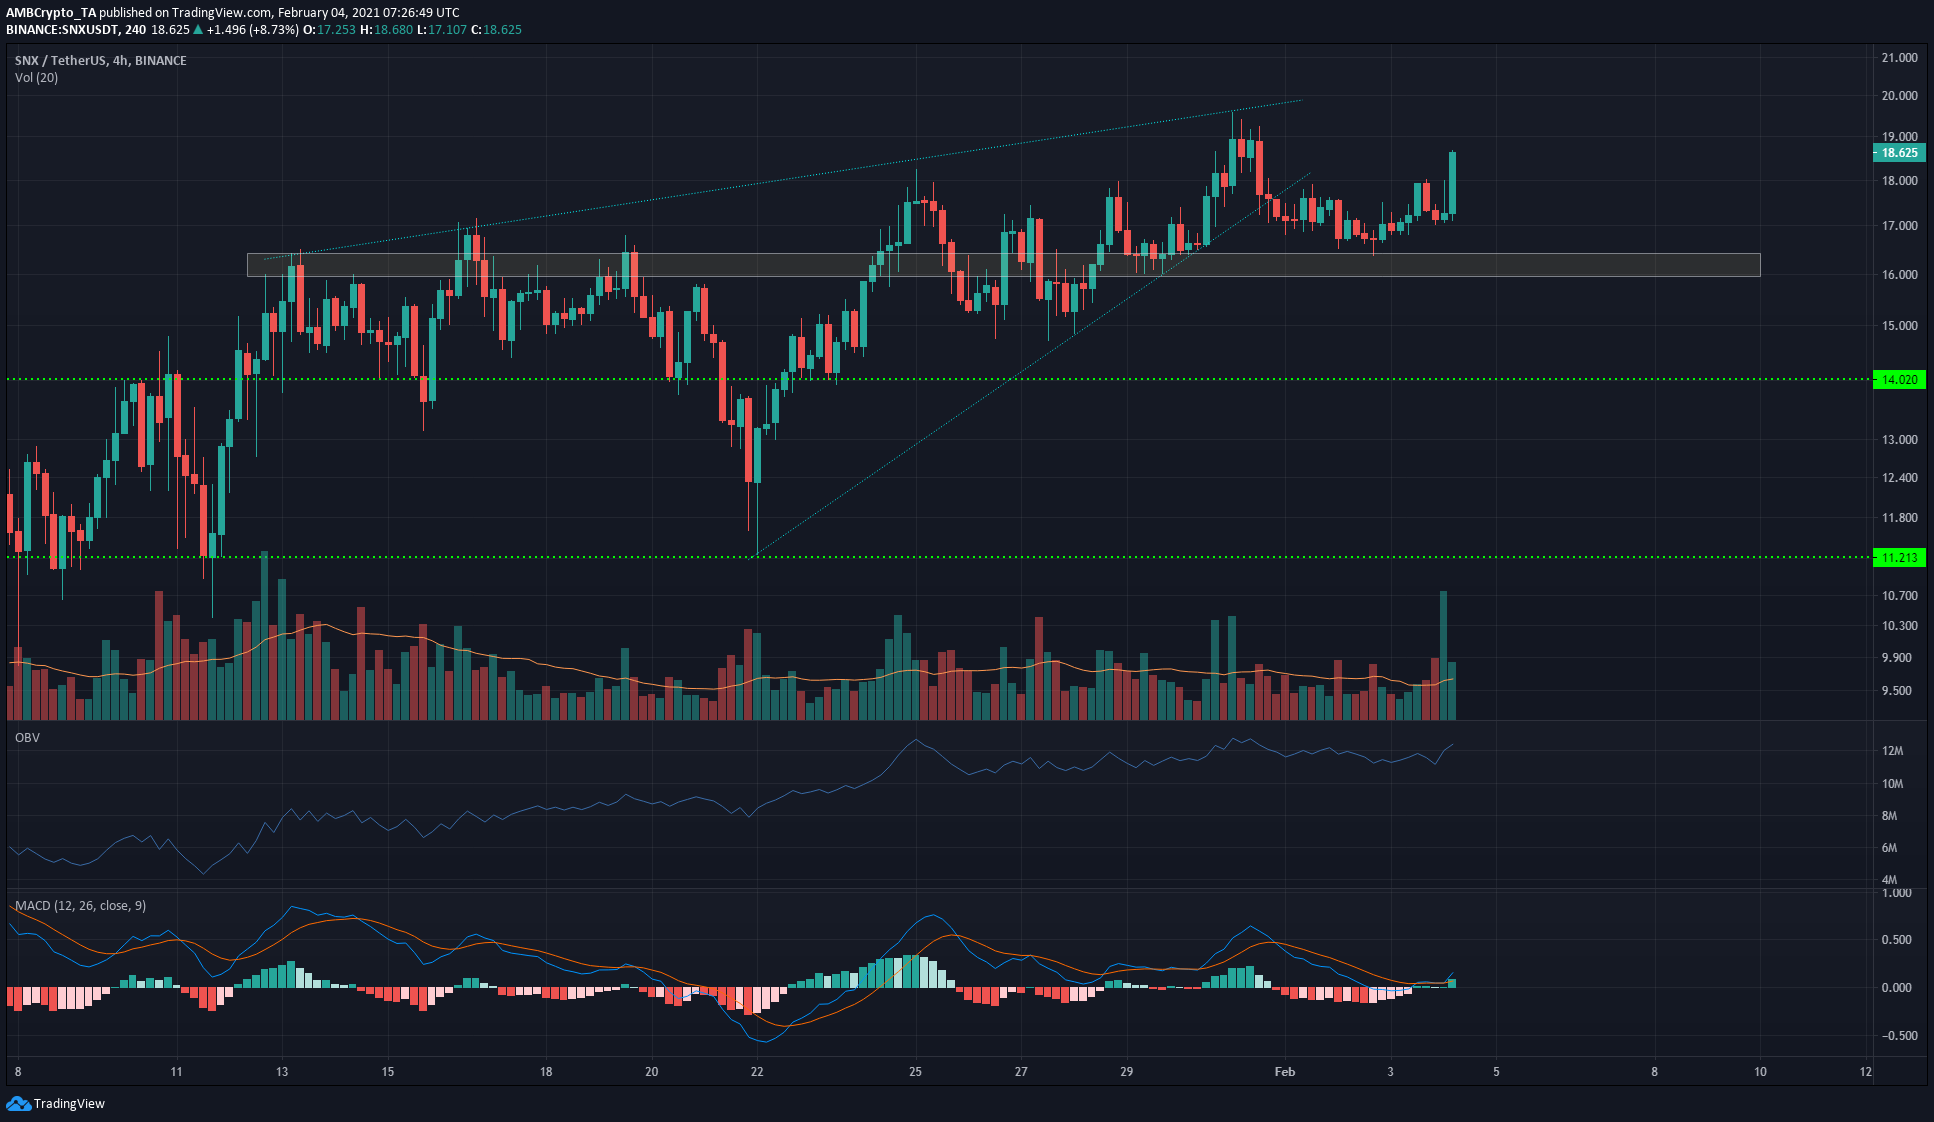
The rising wedge that SNX formed came nowhere close to the expected drop to $14- in fact, the region of demand from $15.95-$16.4 was hardly tested either. The MACD formed a bullish crossover above the zero line to give a strong buy signal, while the trading volume was also notable.
The OBV was in a steady uptrend to highlight demand as Synthetix prepared to breach $19 on the charts.
Uniswap [UNI]
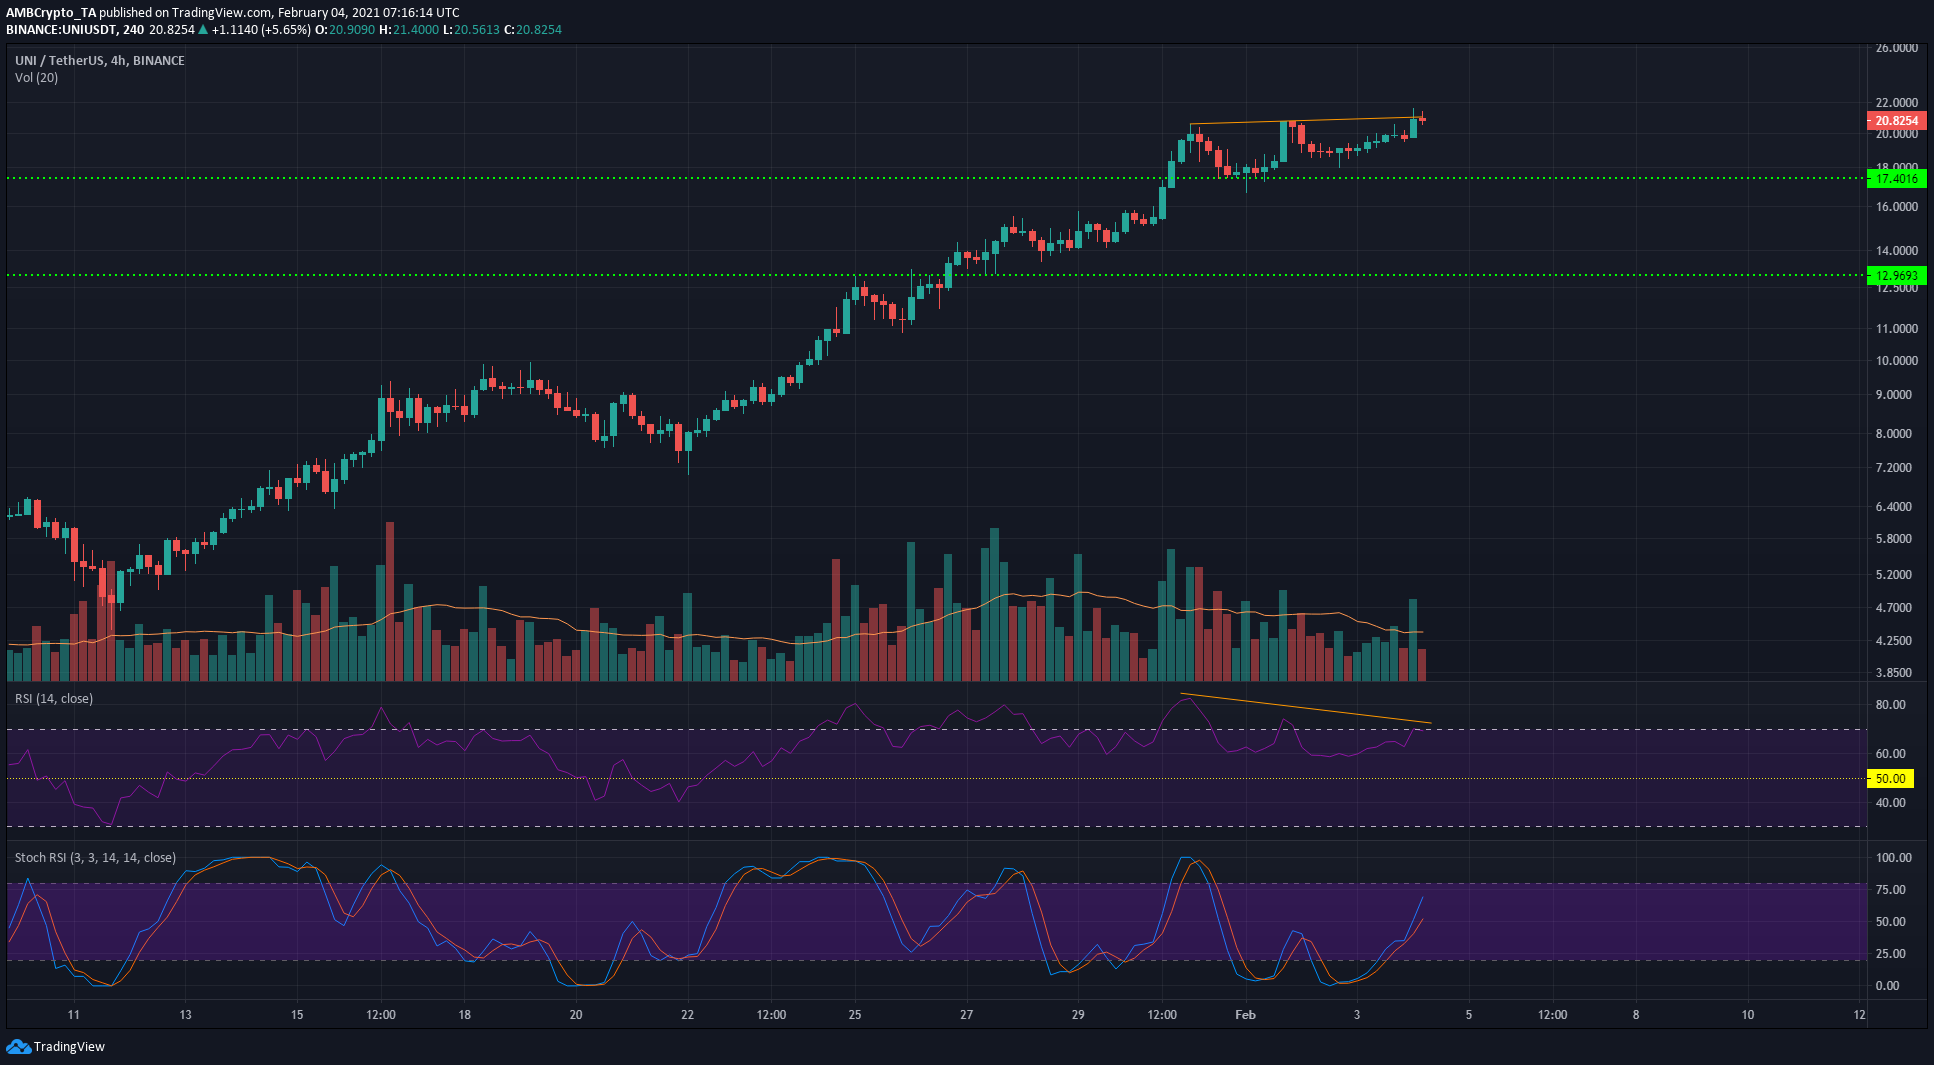
Uniswap’s direction in the market since November has been upward-only on the charts. Some minor pullbacks were seen, and it appeared that UNI was ripe for another.
A bearish divergence between price and momentum (RSI) was spotted on the 4-hour chart. This divergence suggests that the coin is likely to see a pullback but doesn’t highlight when. The formation of a Doji candle with high trading volume would be an early indication of a short-term reversal.
Moreover, this bearish divergence was seen across both the shorter (1-hour) and the longer (6-hour, 12-hour) timeframes, reinforcing the likelihood of a pullback for UNI. It can expect to find support in the $19 region and at $17.4 beneath it.