Polkadot, Terra, MANA Price Analysis: 10 January

The market leader’s inability to uphold crucial support levels has cost the mass cryptos colossally. As Polkadot tested the $23.11-mark support, DOT bulls needed to uphold it to prevent likely breakdowns. Also, MANA lost the vital $2.7-level, at the time of writing.
Although Terra managed to ensure the 61.8% Fibonacci level, it exhibited bearish tendencies.
Polkadot (DOT)
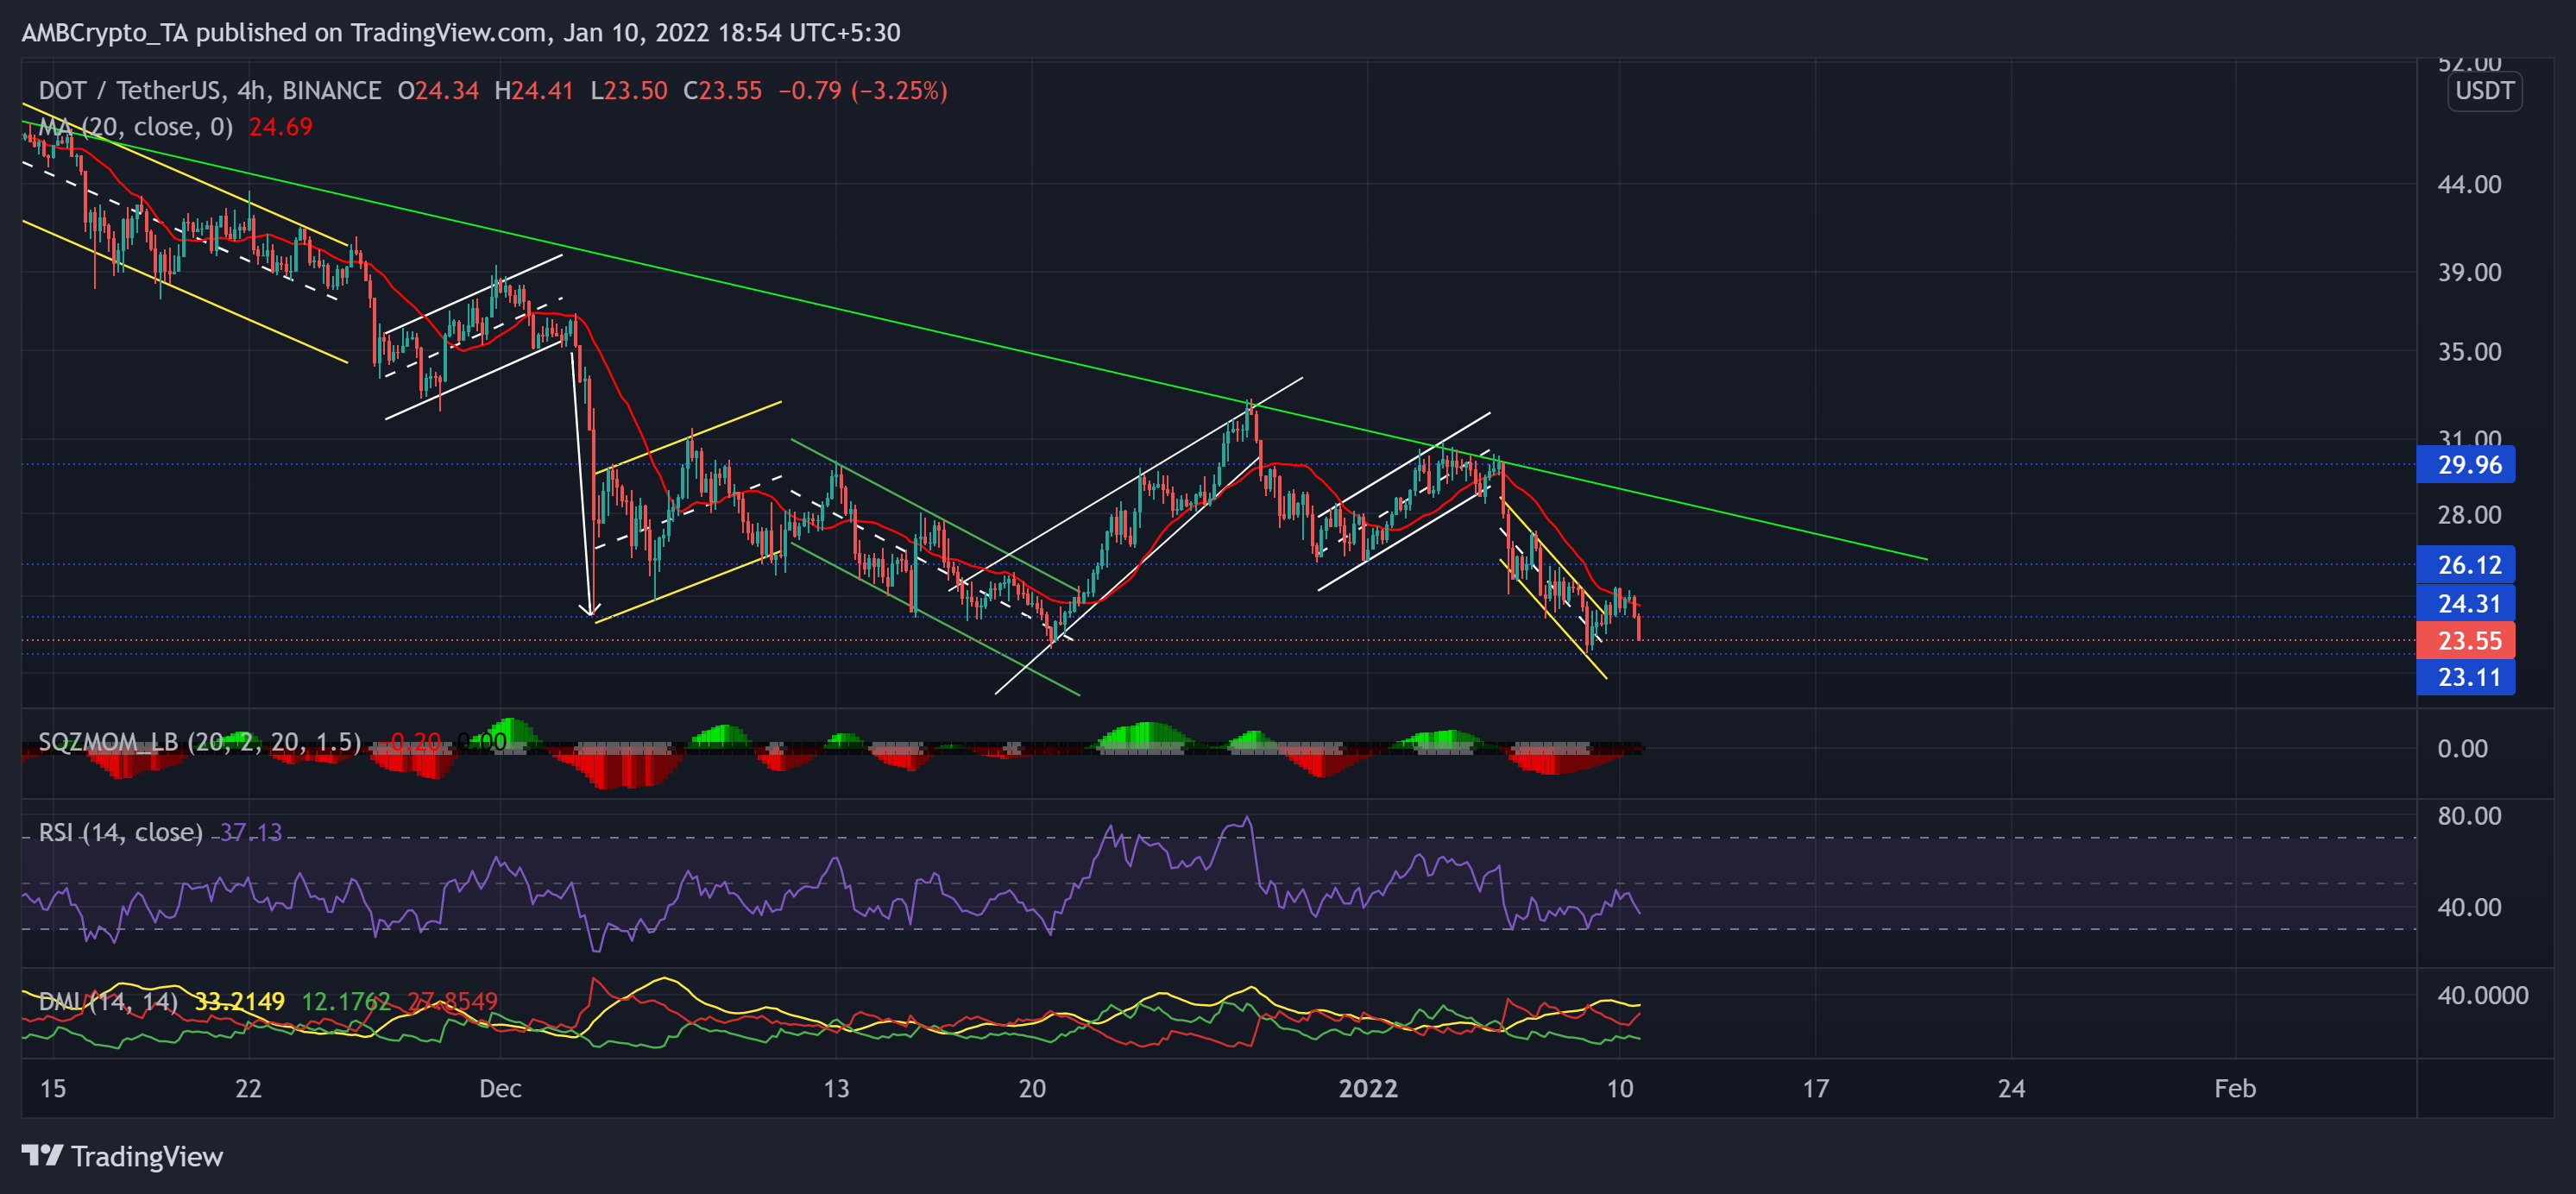
DOT marked lower peaks on its bearish trendline (green) for the past two months while testing the five-month support at the $23.11-mark. This movement depicted the gradually increasing selling pressure.
The recent down-channel (yellow) breakout rebounded from the 20 SMA (red) as it stood as a sturdy resistance in the past week. Now, the alt may retest the $23-mark and continue to find near-term resistance at the $24.3-level. The Squeeze Momentum indicator continued to hint at a low volatility phase.
At press time, DOT traded at $23.55. The RSI looked south as it endeavored to retest the oversold region. It would only be rational to assume a near-term bearish move from here while the -DI (red) looked north.
Terra (LUNA)
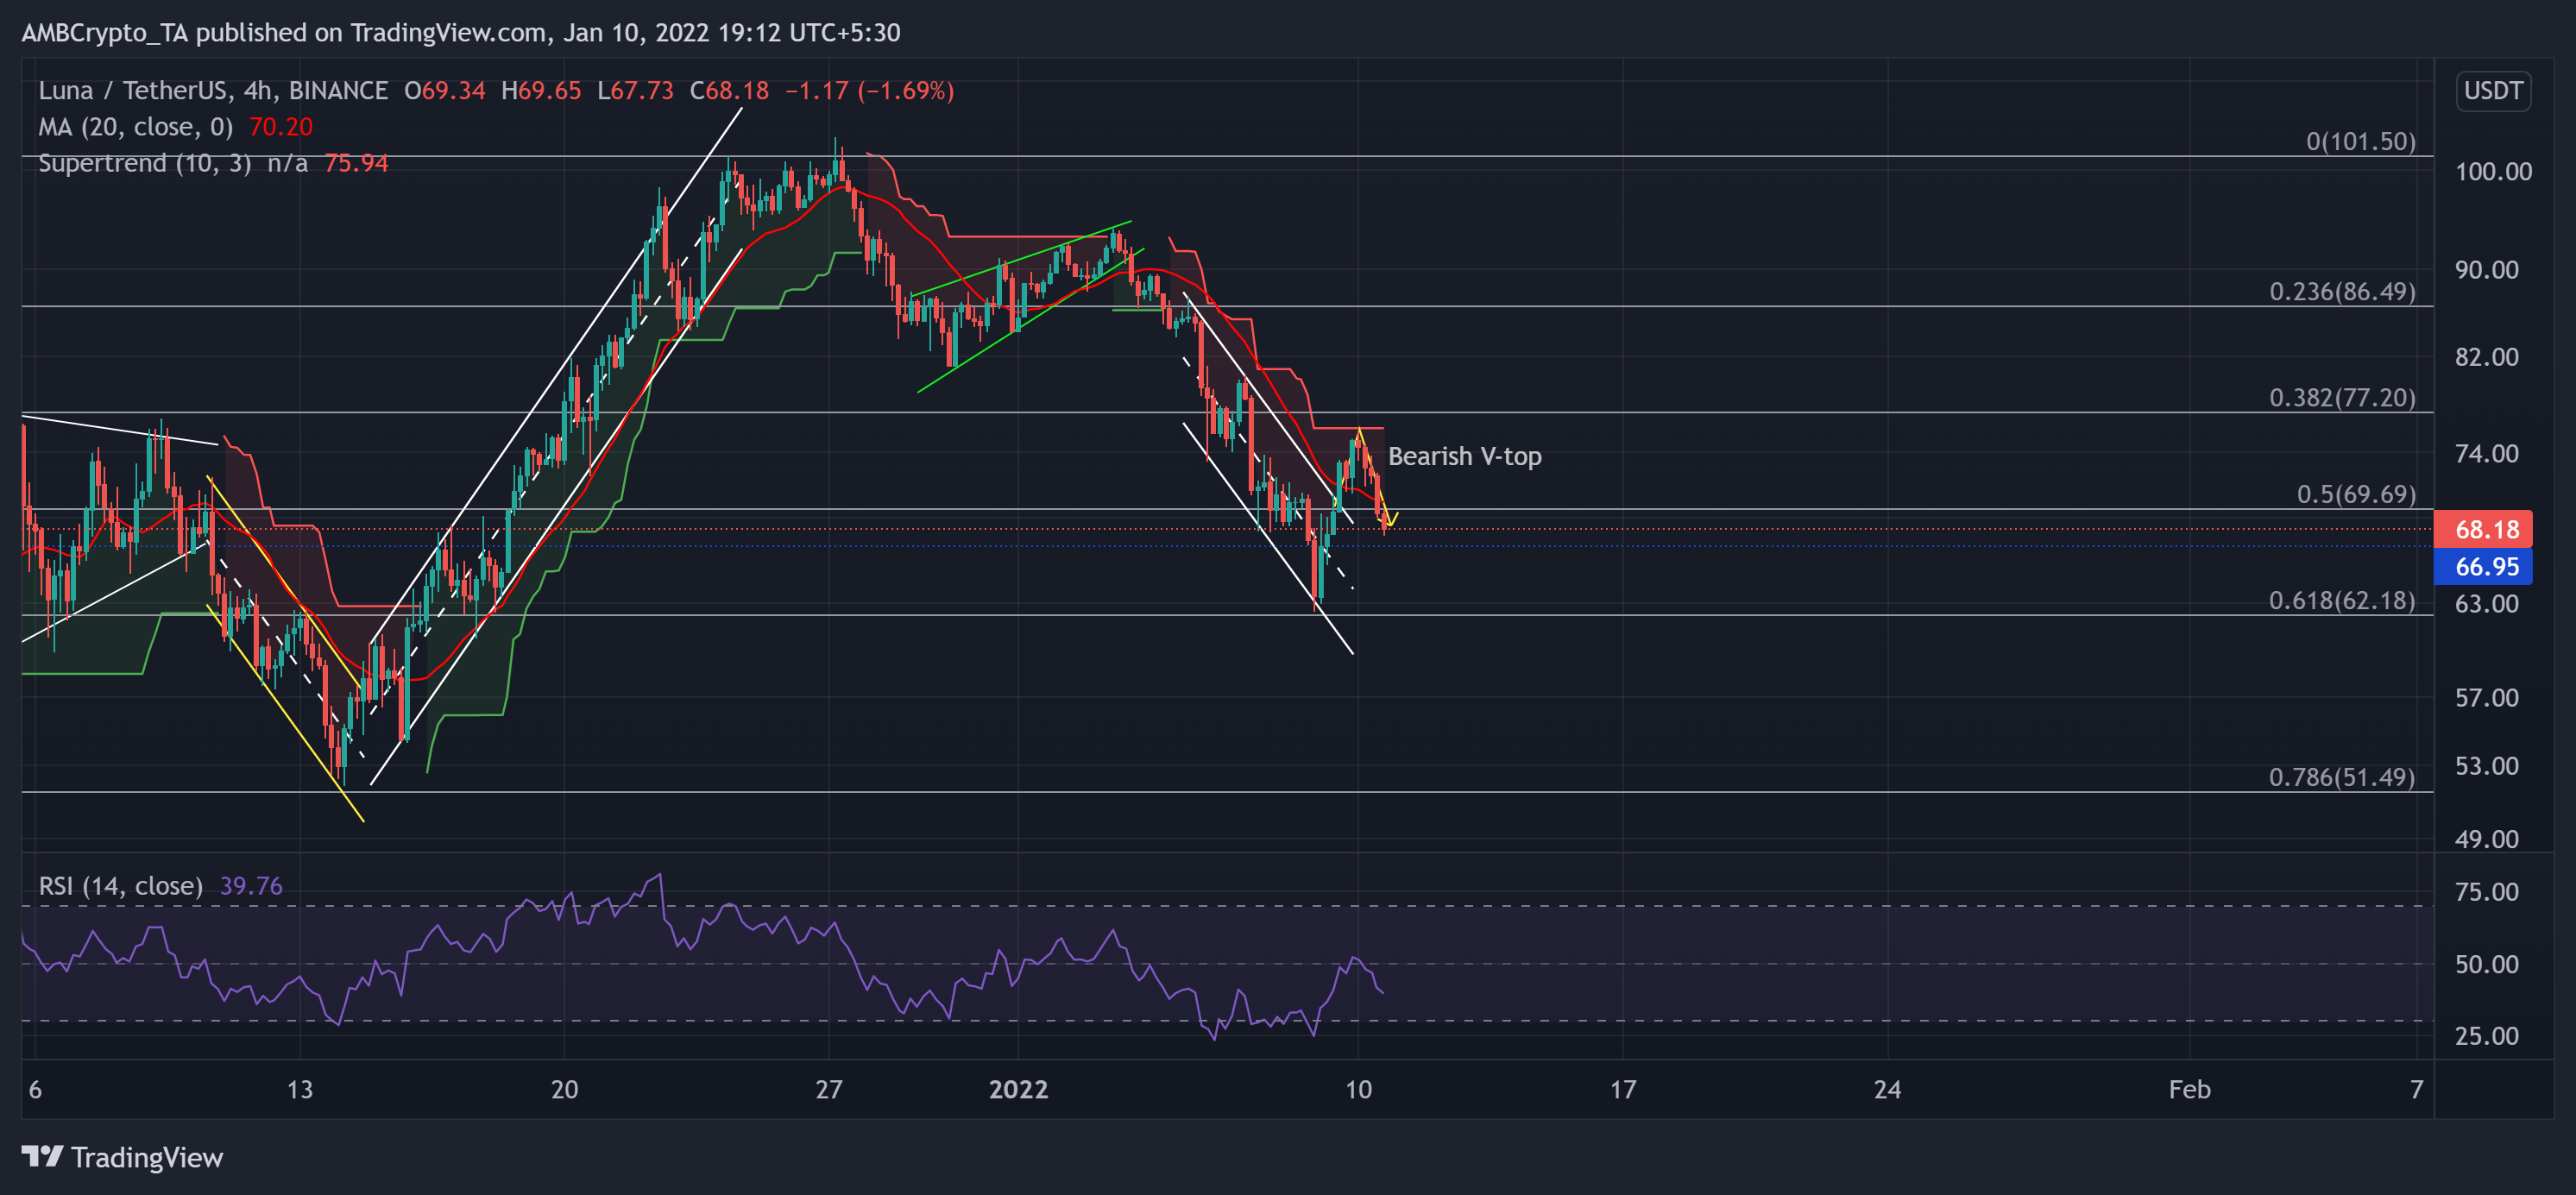
LUNA saw an exceptional 99.96% up-channel rally (from 14 December low) until it touched its ATH on 27 December.
Over the past week, the alt saw an expected rising wedge (green) break down on its 4-hour chart. The alt marked a staggering 31.67% decline in a down-channel (white). But it found strong support at the 61.8% Fibonacci level.
Now, LUNA saw a bearish V-top on its 4-hour chart as it lost the 50% level. The 20-SMA (red) continued to act as strong resistance. Any further breakdowns would find testing support at the $66.9-level.
At press time, LUNA traded 34% below its ATH at $68.18. The RSI saw a steep reversal from the midline and refrained from showing any near-term revival signs. Meanwhile, the Supertrend continued to flash sell signals.
Decentraland (MANA)
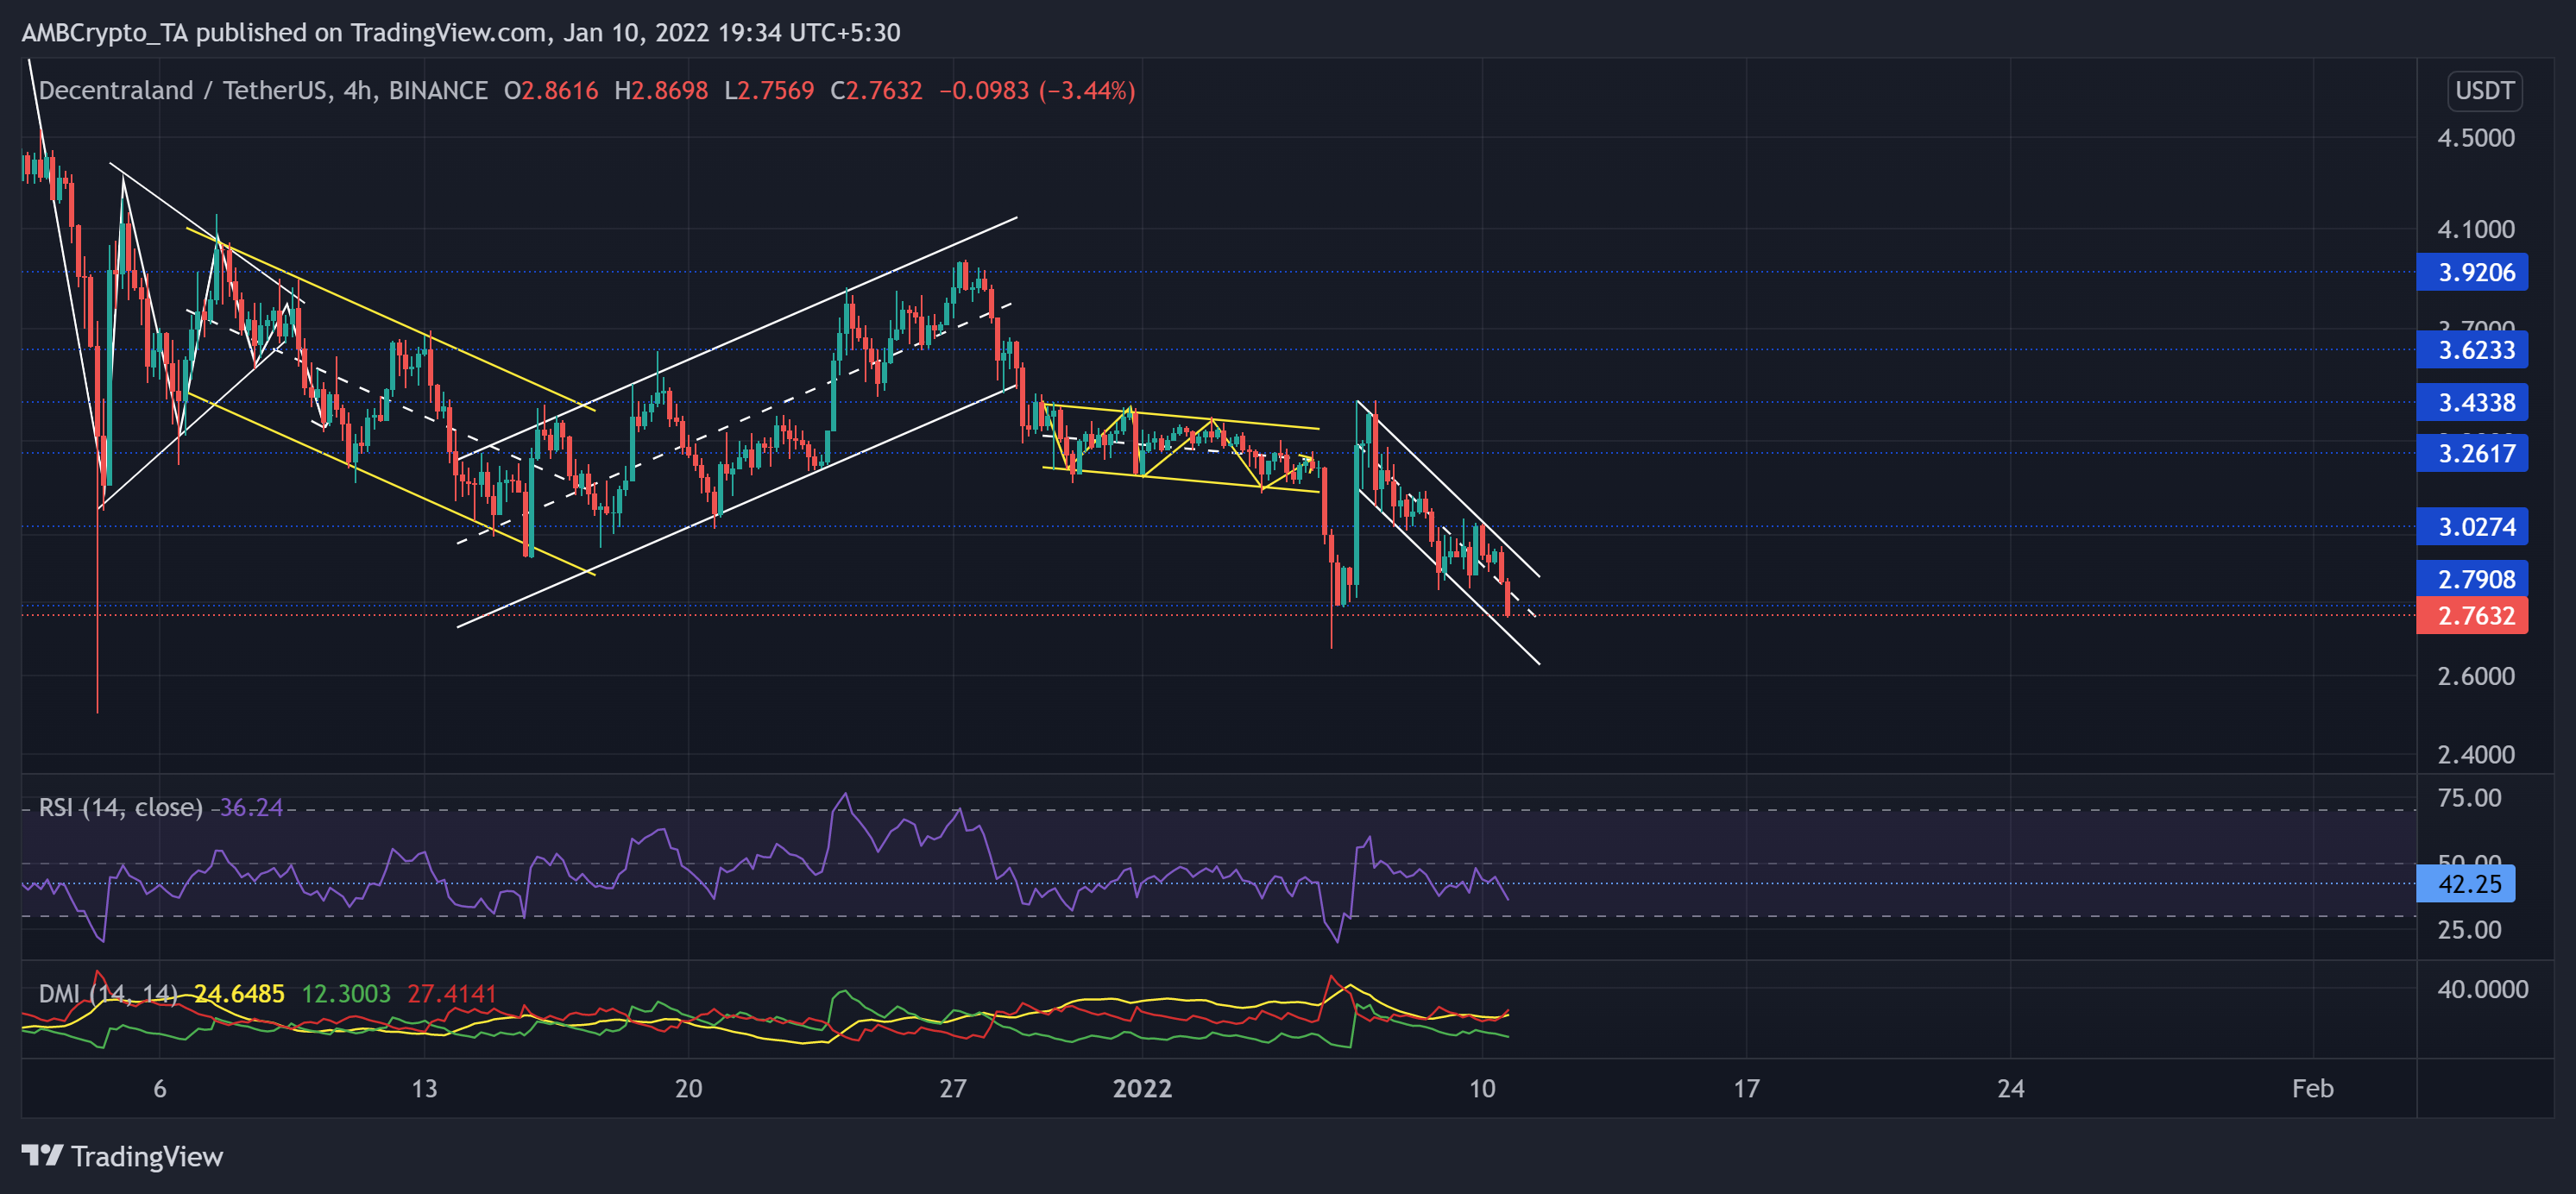
On its 4-hour chart, the alt saw a breakdown from the down-channel until the $2.7-mark two-month support (now resistance). But with Samsung stepping into the Decentraland metaverse, the token saw a 22% Jump on 6 January.
However, it succumbed to the broader sell-off by over-retracing the previous jump in a down-channel (white). It also dropped the month-long oscillating range between $3.92 and the $3.02-mark. Now the immediate support was at the lower trendline of the channel.
At press time, MANA traded at $2.7632. The RSI fell below the midline and yet again found resistance at the 42-mark. Further, the DMI flashed a bearish preference. But the ADX displayed a slightly weak directional trend for the alt.