Polkadot, Tezos, Elrond Price Analysis: 22 March

Polkadot looked uncertain of rising above the $38.2 resistance on low volumes. Tezos moved within a horizontal channel and projected an upwards breakout, while Elrond negated a descending triangle after moving above the upper trendline.
Meanwhile, Bitcoin at the time of writing was trading at $57,226 with a 24-hour trading volume of over $46.4 billion.
Polkadot [DOT]
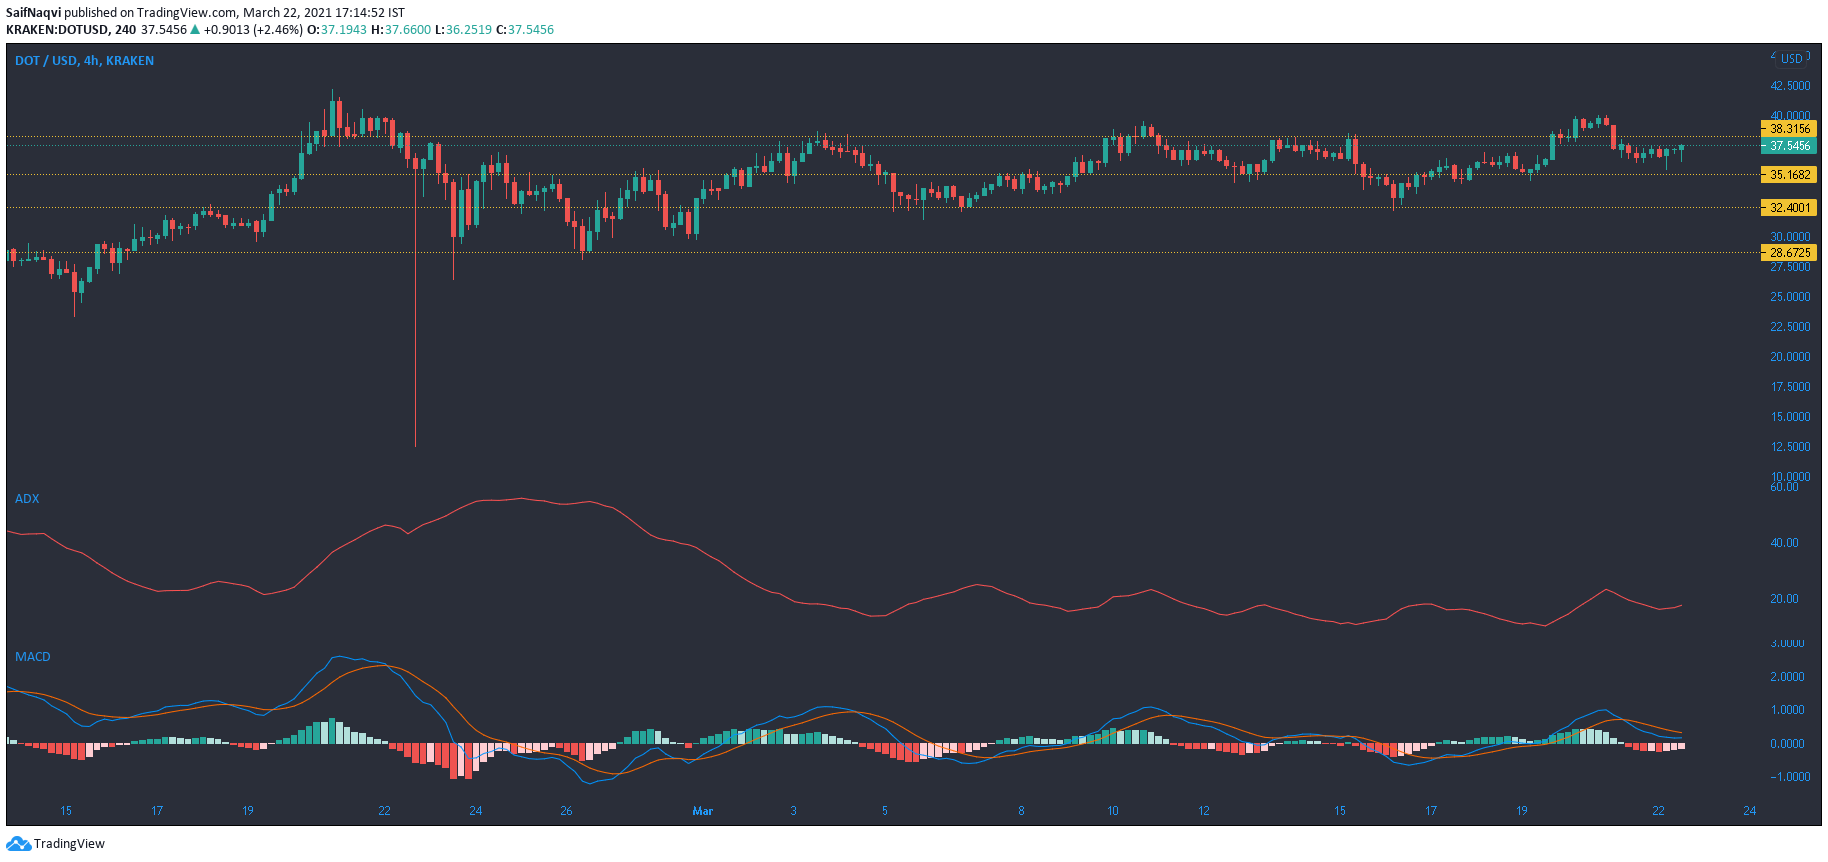
The short-term target for Polkadot bulls rested above $38.2 resistance, a region that has seen a domination of sellers. While the world’s sixth-largest cryptocurrency did tick up at the time of writing, gains were not enough to warrant an upwards breakout towards its immediate ceiling. A 28% fall in the 24-hour trading volumes added some more skepticism, which did not favor a big price swing over the coming sessions.
The ADX floated around 17 and showed the lack of a trend in the market. The MACD line moved below the Signal line, while the histogram noted weakening bearish momentum. A bullish crossover could trigger a move away from the present channel.
Tezos [XTZ]

Tezos’ range between $3.7 and $4.5 showed good oscillation between the two trendlines and an upwards breakout was projected over the short-medium term. The favorable prediction came after XTZ rose north after moving between its previous channel of $3.2-$3.7. However, the price was at the mid-point of its channel and showed a balanced market at press time.
The RSI moved flat along the 50-mark, while the ADX pointed lower from 20. The previous breakout occurred on high volumes, and the same must be observed for a bullish outcome from the current channel as well.
Elrond [EGLD]
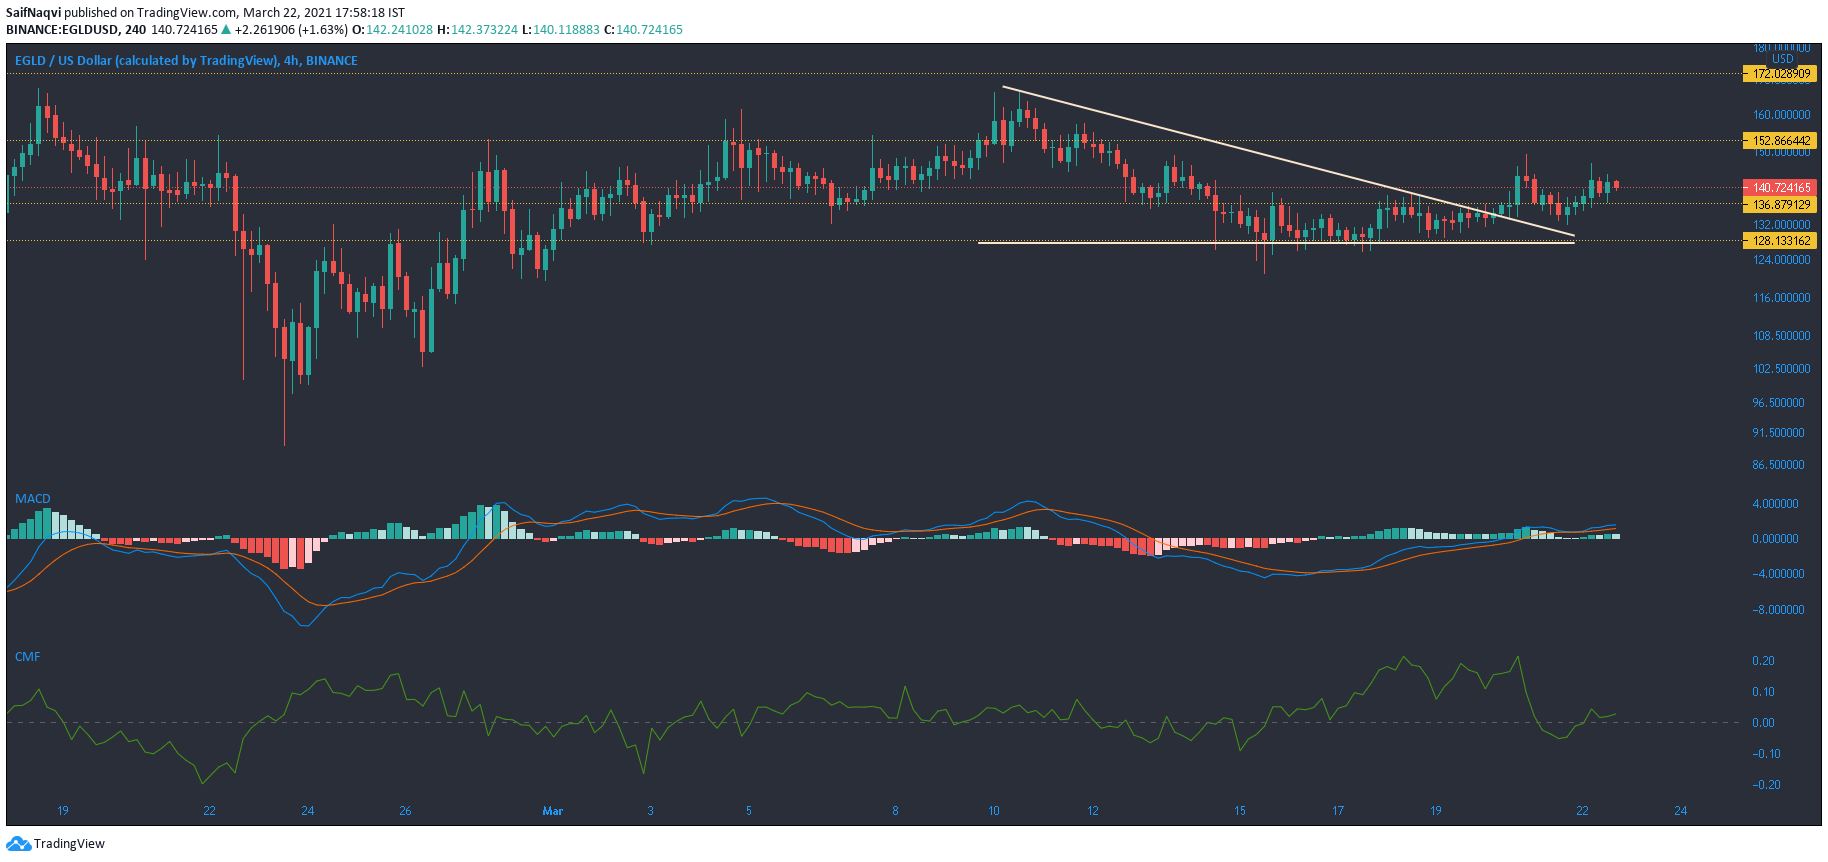
A rise above the upper trendline negated a descending triangle on Elrond as the price moved north of the $136.8-resistance. While a retest did occur at the aforementioned level, the bulls were successful in holding the price above the newly flipped resistance line. The MACD line continued its movement above the Signal line, although the histogram did note some weakening bullish momentum.
The Chaikin Money Flow moved above the equilibrium-mark and suggested that capital inflows may have lent a helping hand in EGLD’s resurgence above the $136.8 point. The next target for the bulls rested at the $152.9-level.