Polkadot traders can long here to get in on the rally

Disclaimer: The findings of the following analysis are the sole opinions of the writer and should not be taken as investment advice
While some alts faced an extended drawdown post 7 September, Polkadot seemed to be a bit of a rebel. Bucking the broader market trend, DOT kicked off a strong rally which peaked at $38.4 – A near 4-month high for the digital asset. Moreover, its weekly gains of 30% easily bested other coins in the top 10.
Supported by healthy on-chain metrics and development activity, the long-term outlook sat favorably for the world’s eighth-largest cryptocurrency. However, in the near term, some selling pressure was starting to creep into the market, with the focus shifting towards the lower trendline.
At the time of writing, DOT was trading at $36.6 after gains dipped to 1.8% over the last 24 hours.
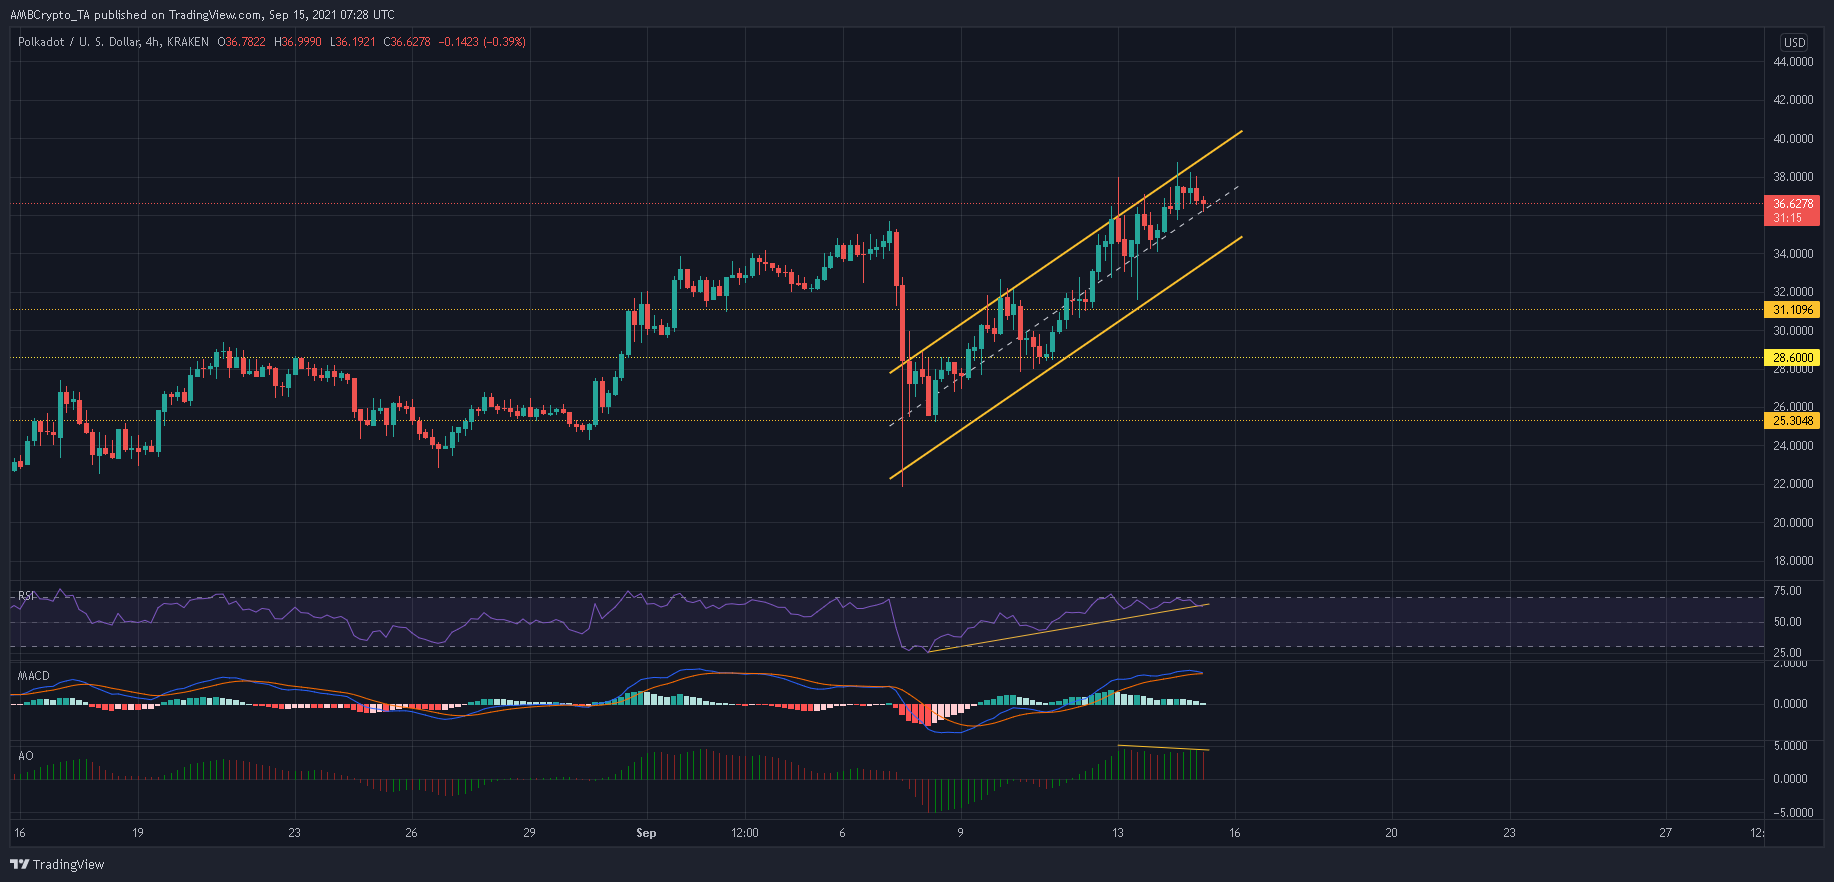
Polkadot 4-hour Chart

Source: DOT/USD, TradingView
Since bouncing back from lows seen after 7 September, DOT’s price has oscillated within the confines of an up-channel. New highs and a fresh local top at $38.8 were secured after DOT flipped its 20 and 50 Simple Moving Average lines to bullish. Since then, the market lost a bit of steam as DOT slipped towards the mid-line of its pattern.
A close below $36.1 would pave way for a fresh low at $34, from where a bounceback can be expected. Moreover, an early reversal would see DOT pick up from the mid-line and form a new top around the $40-mark.
On the other hand, a bearish outcome would see DOT break below the lower trendline of its pattern. Such a move would see the price slip all the way to $31 or even $28.6.
Reasoning
The Relative Strength Index held its position within bullish territory but, at press time, was heading lower after touching the overbought zone. This suggested that stabilization was in effect. However, this could spiral into a breakdown if the RSI moves below equilibrium and into the bearish zone.
Meanwhile, the MACD approached a bearish crossover above its half-line – A development that usually acts as a sell signal. Similarly, the Awesome Oscillator noted two lower peaks as upwards pressure gradually declined.
Conclusion
DOT’s market remained vulnerable to a near-term sell-off. The 24-hour trading volumes diminished by 36% as buying pressure eased across the market. As a result, the price can be expected to fall towards the lower trendline of its up-channel, one from where a reversal can be anticipated.
The aforementioned indicators were still trading above their half-lines and an extended sell-off seemed unlikely, however. In order to capitalize on DOT’s bull run, traders can long the alt once it forms a new low at $34.1.


