Polkadot, Uniswap, AAVE Price Analysis: 28 February

Although Polkadot, Uniswap and AAVE picked themselves up from their multi-month lows on 24 February, the broader sentiment has taken a plunge into the extreme fear zone at the time of writing. Uniswap showed promising signs as it hovered around the upper band of its Bollinger Bands. But like AAVE, Uniswap depicted a weak directional trend.
Polkadot (DOT)
Since its ATH in November of 2021, DOT bears have refrained the bulls from turning the tide in their favor. The alt was down by over 74% (from 4 November) as it gravitated towards its seven-month low on 24 February.
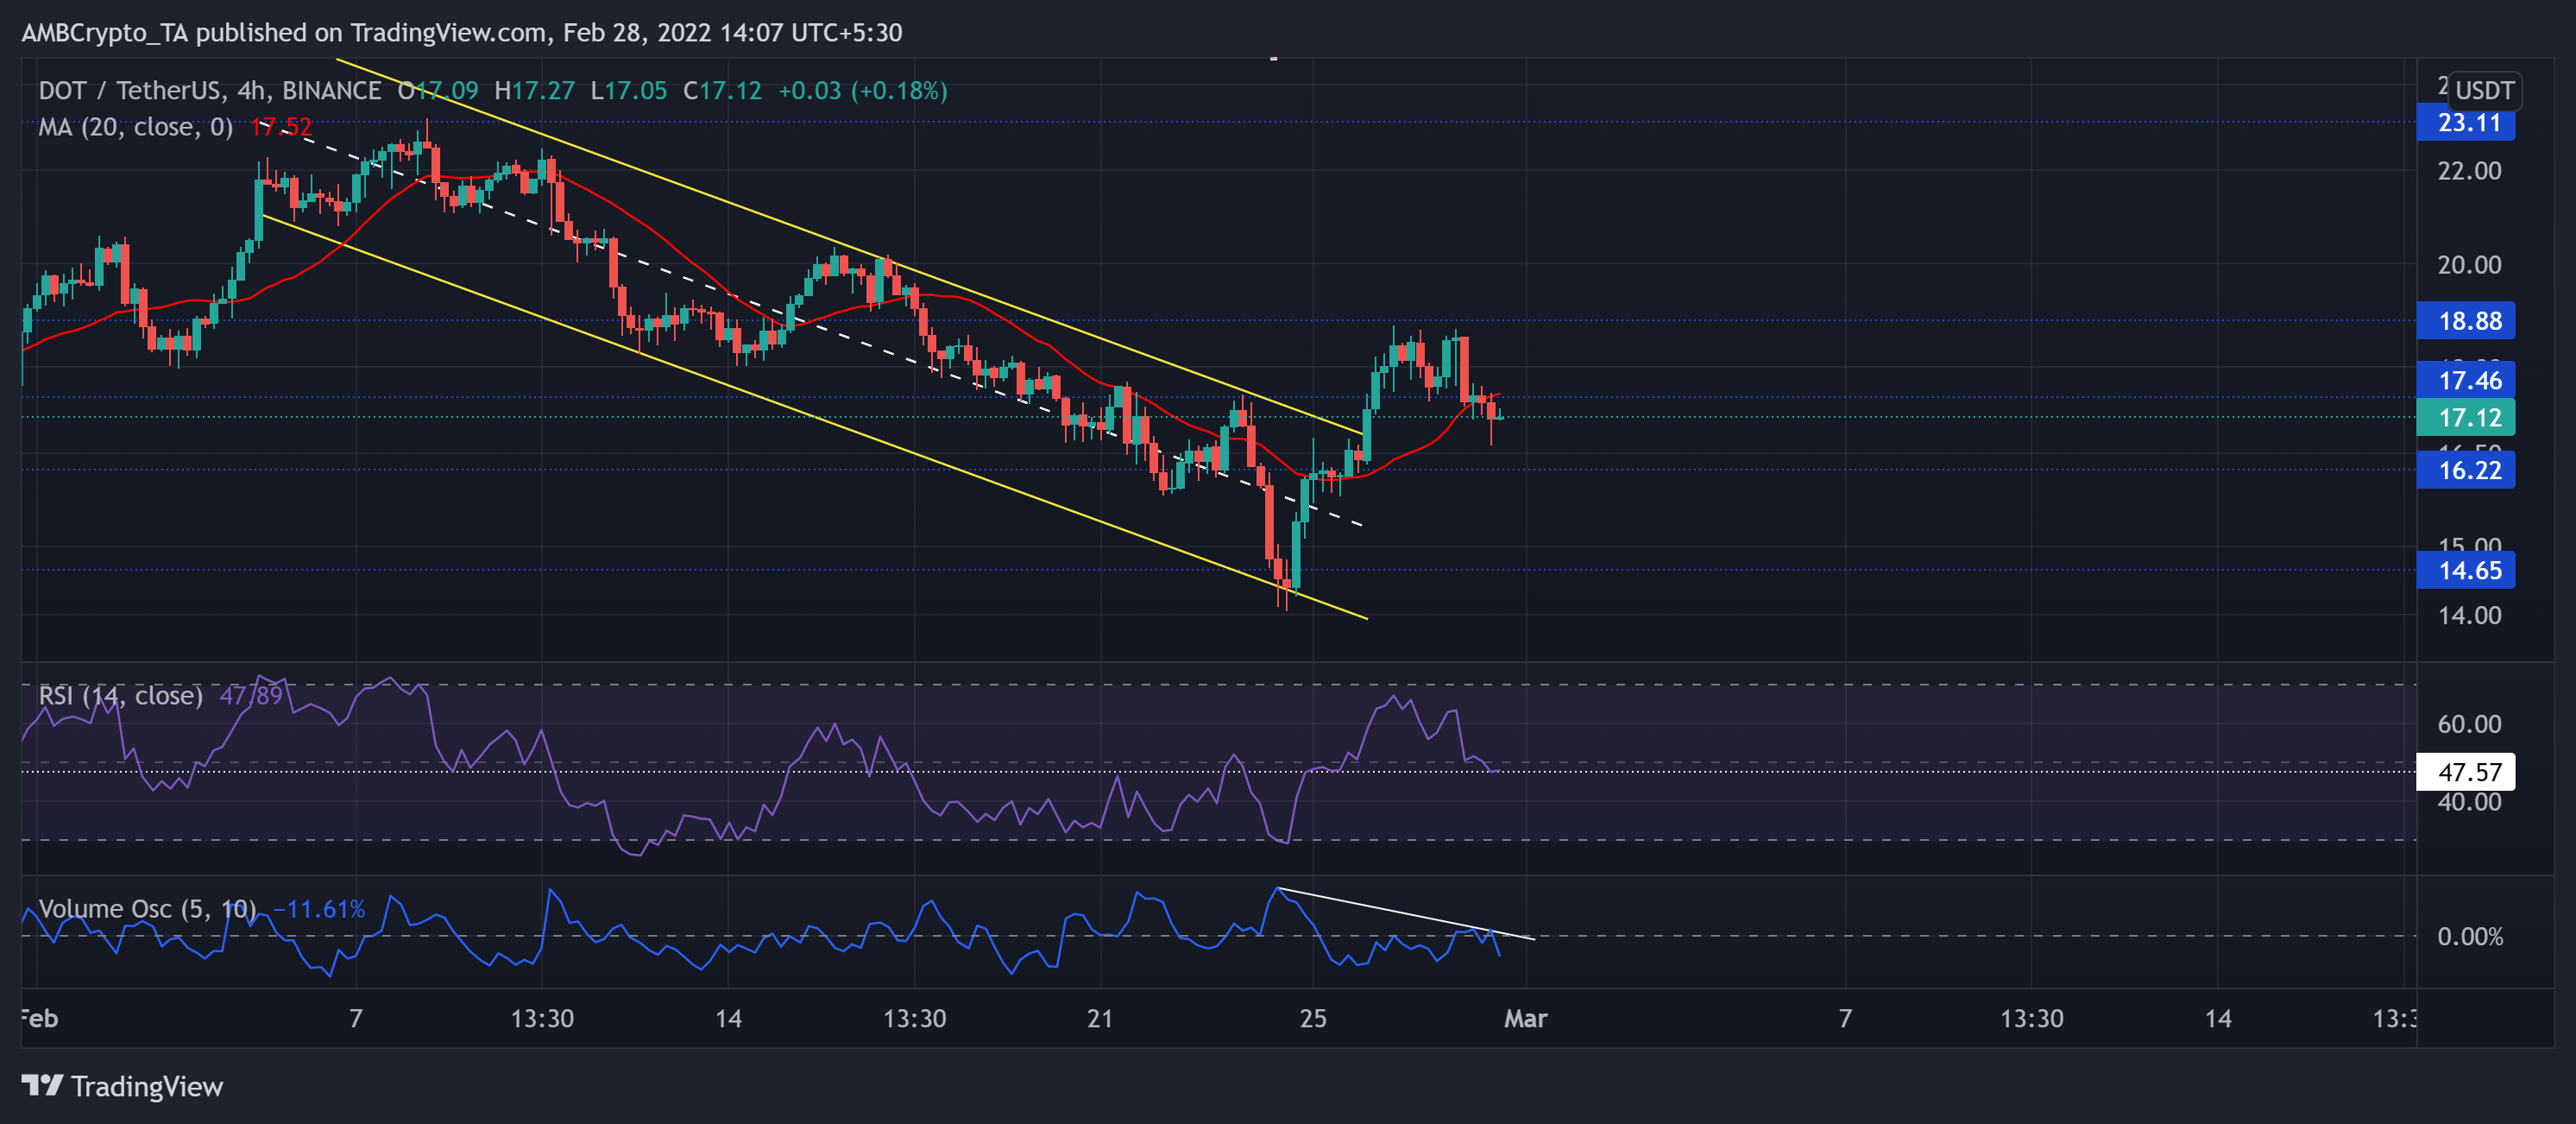
The recent bearish rally marked a down-channel while the alt strived to cross the 20 SMA (red). Over the last few days, the alt reclaimed the vital $16-mark after breaking out of the channel. If the bears ensure a close below the $17-level, a further retest of the $16-support would be likely.
At press time, the DOT traded at $17.12. The RSI dropped by nearly 15 points over the past day. The bulls needed to defend the 47-support to prevent a potential fallout. Furthermore, the Volume Oscillator is on a downtrend, revealing that the recent breakout still needed more thrust to find a sustained close above the 20 SMA.
Uniswap (UNI)
Ever since losing the $15.3-mark, UNI bulls have not been able to propel a trend-altering rally. The alt noted a 53.09% fall (from 21 January) and touched its one-year low on 24 February.
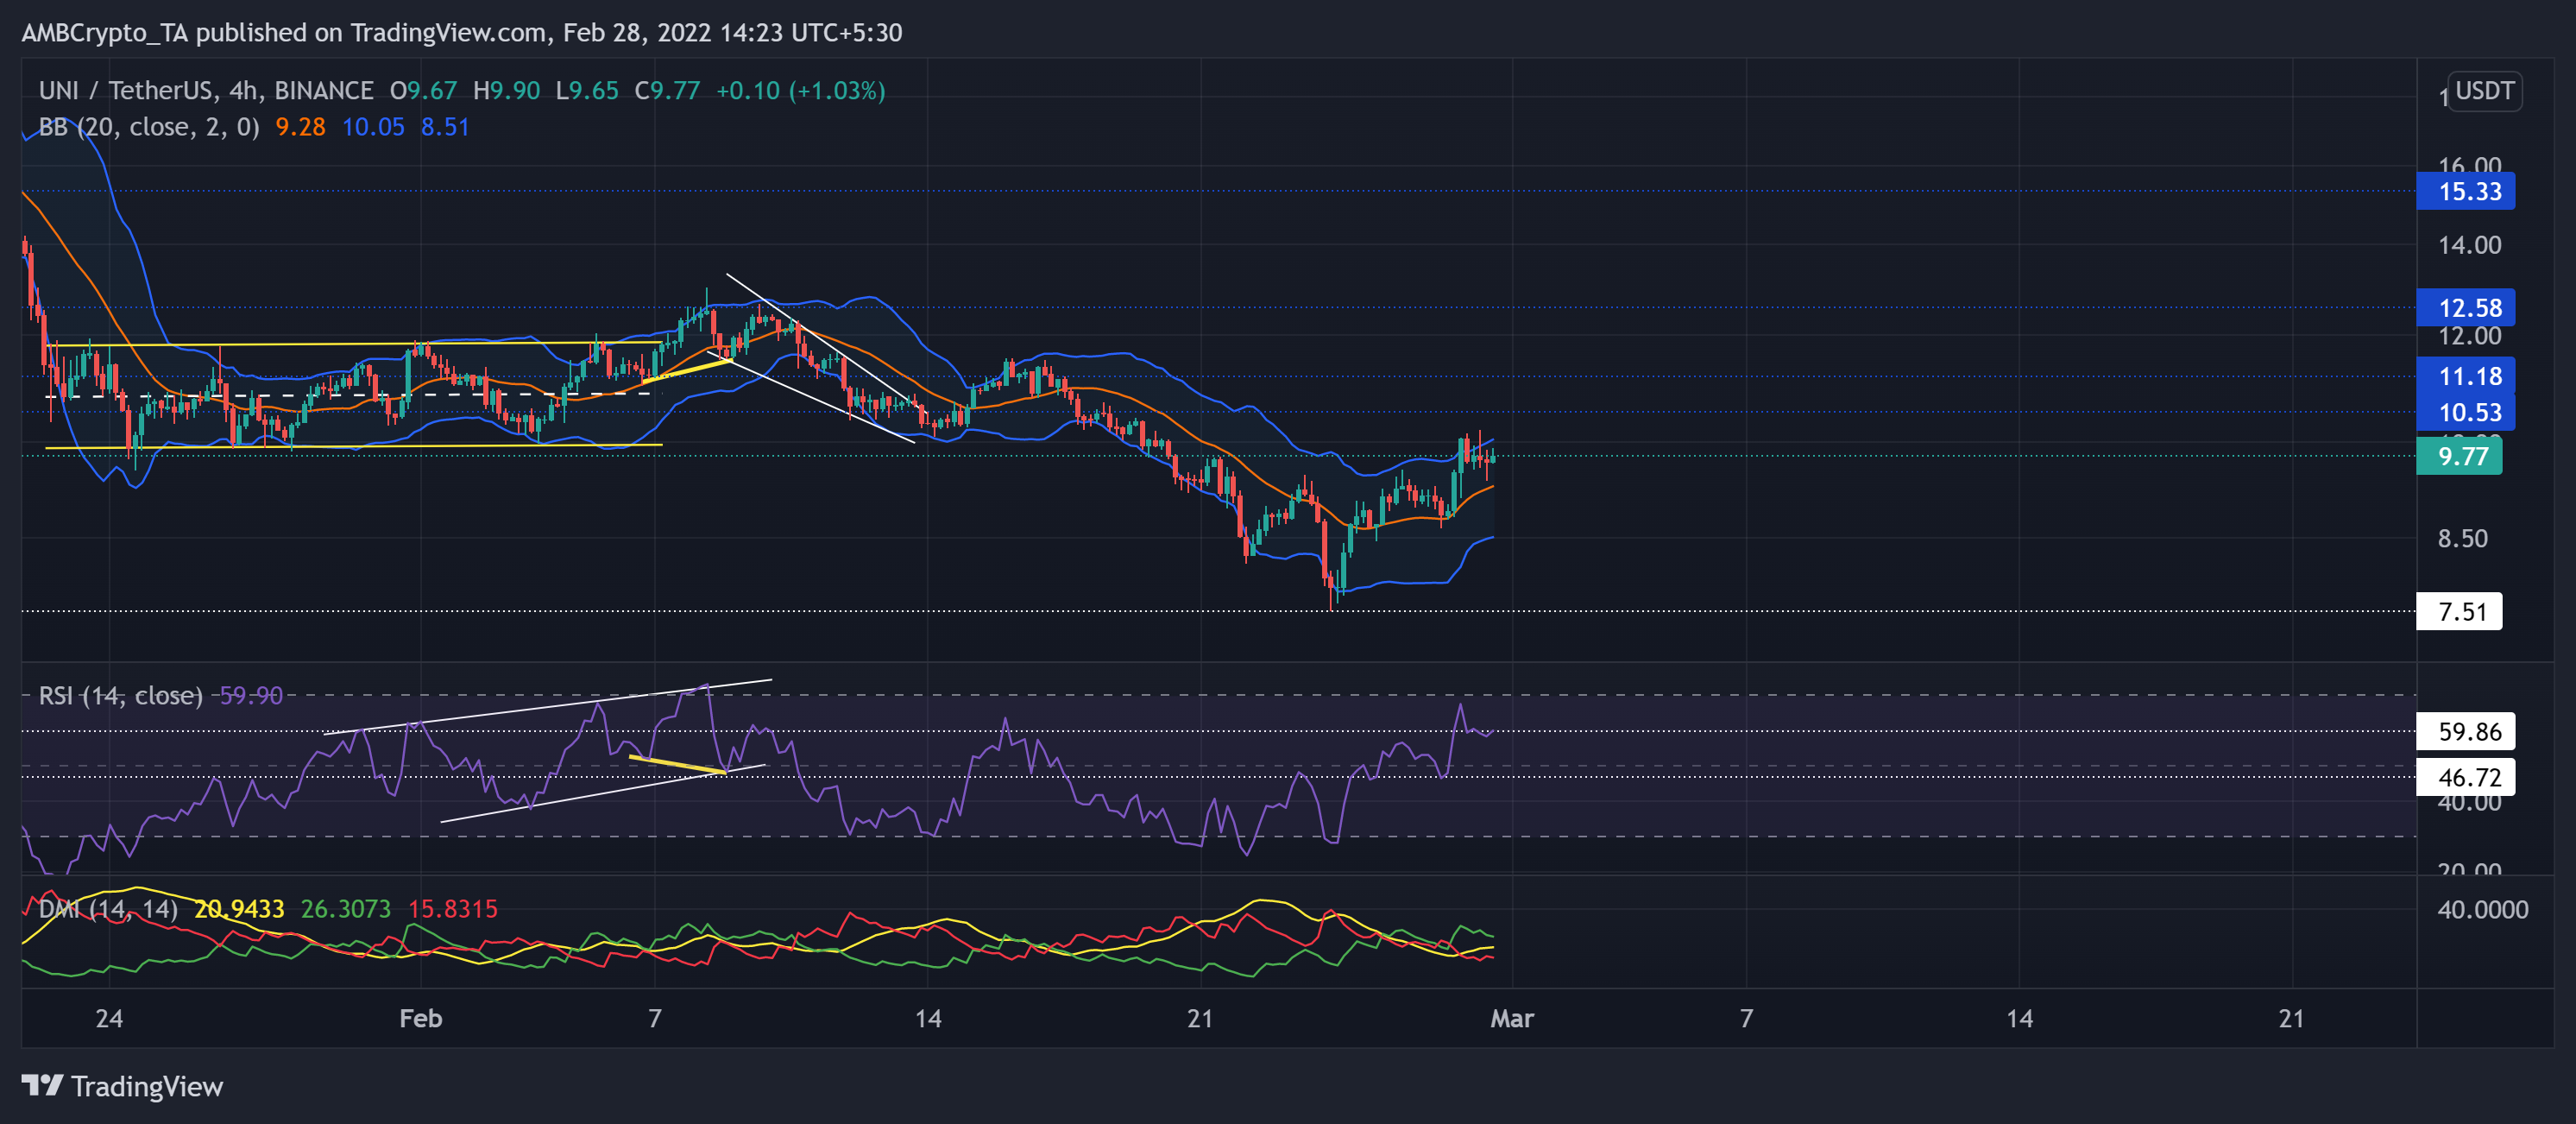
Since then, UNI initiated a 35.5% recovery, poked the upper band of the Bollinger bands (BB). As a result, it flipped the mean of BB from resistance to immediate support. Now, as the bulls kept testing the upper band, the buying strength heightened.
At press time, the alt was trading at $9.77. After picking itself up from the crucial 46-point level, the RSI swayed above the midline and continued to face a barrier at the 60 mark. Also, the DMI lines affirmed the bullish edge. But the ADX displayed a weak directional trend for UNI.
AAVE
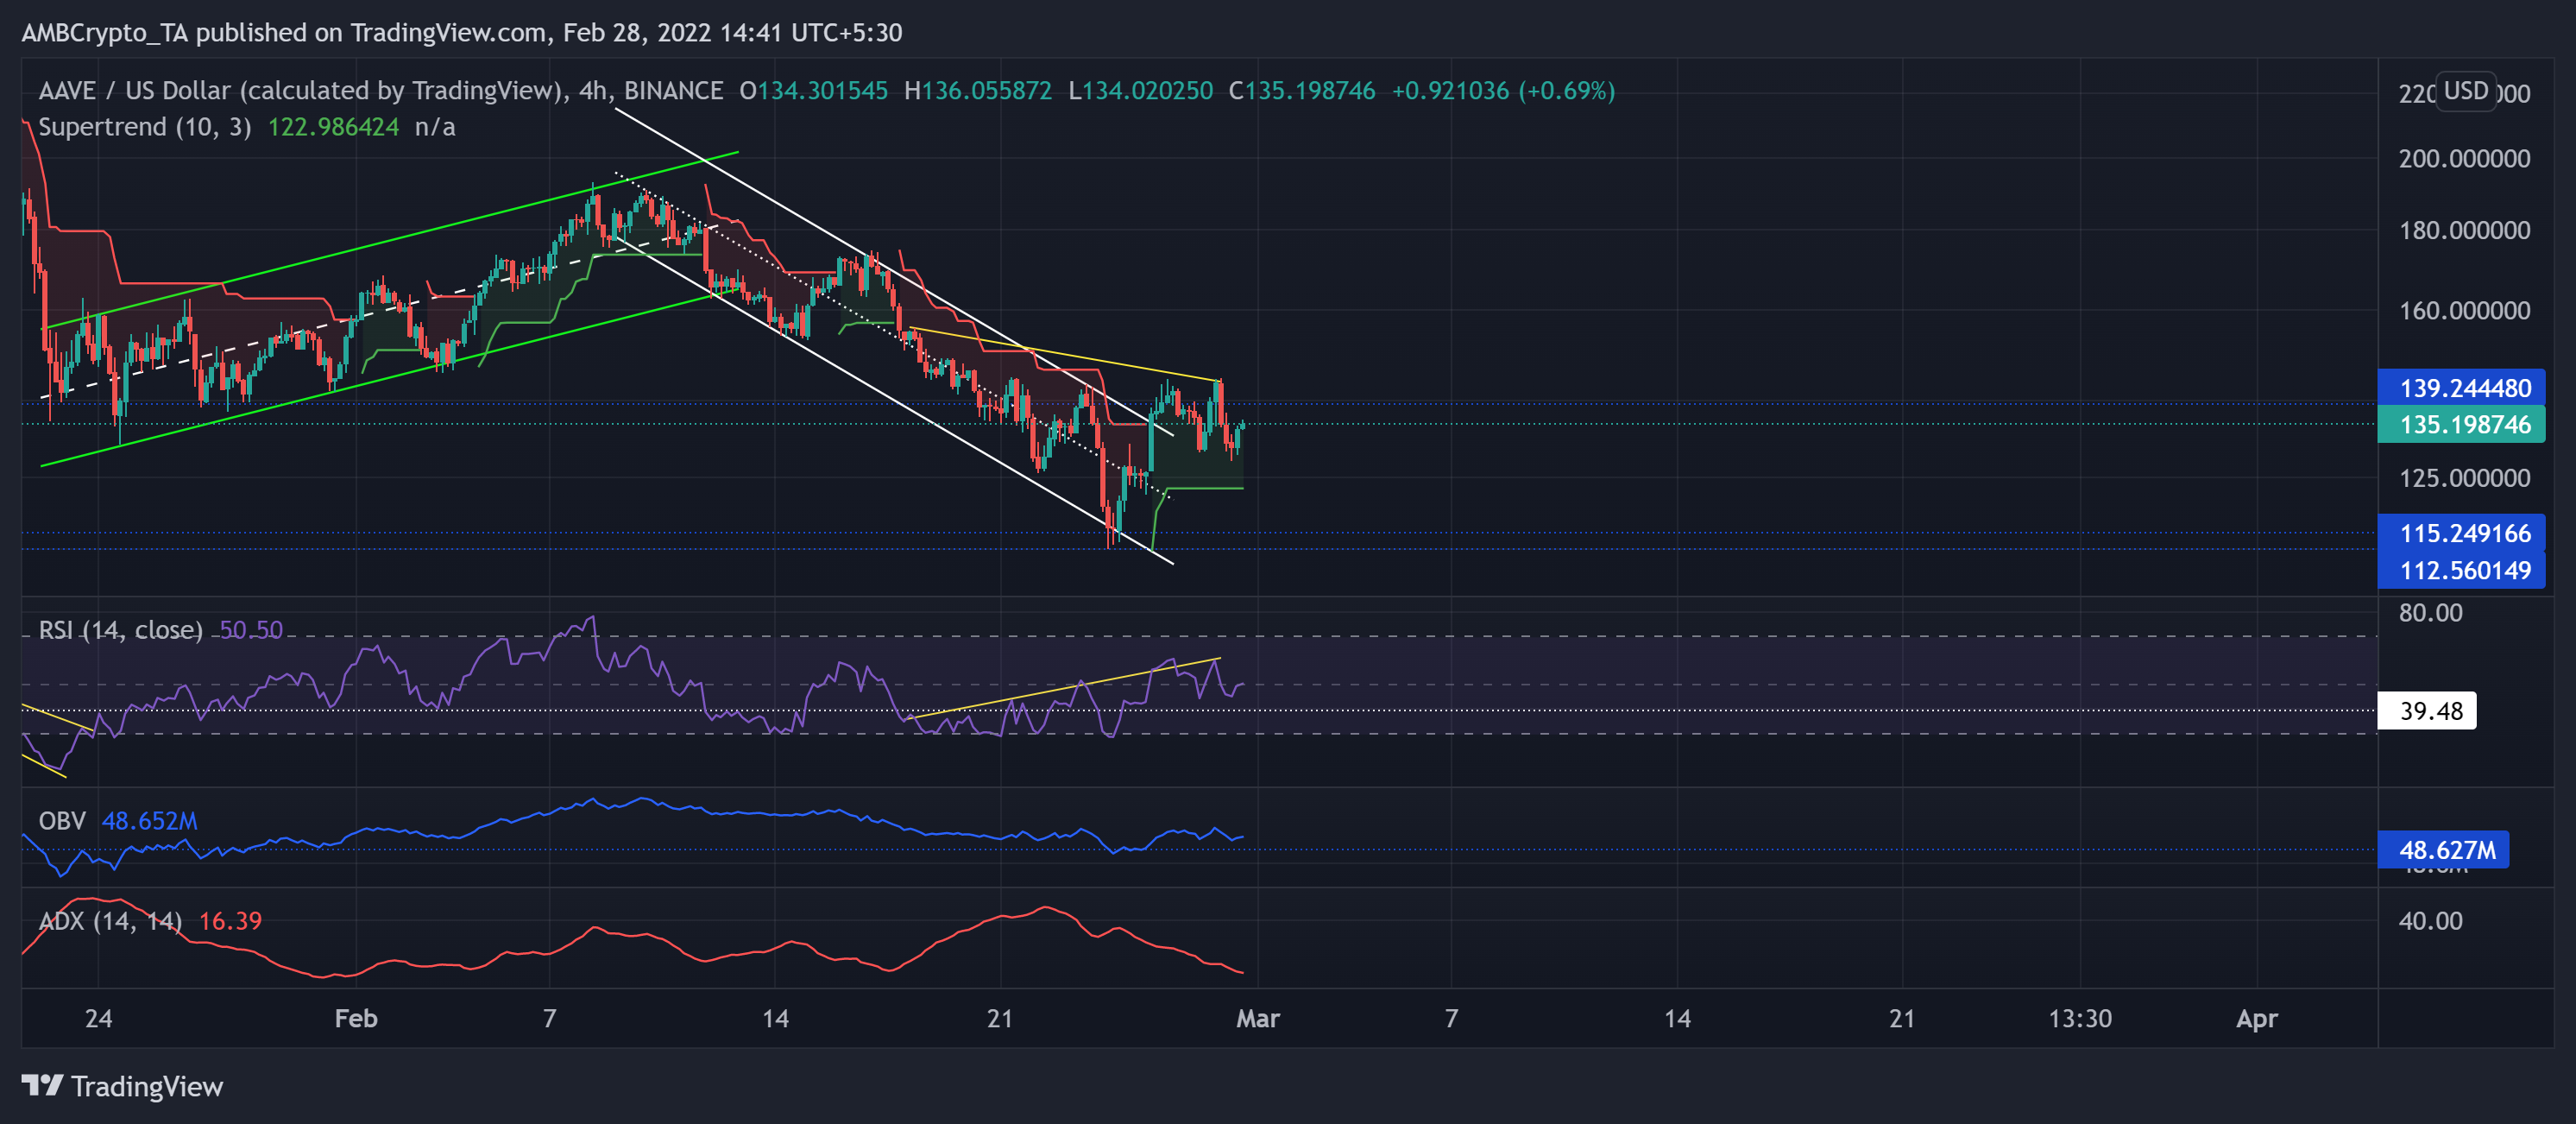
After its up-channel (green) breakdown, bulls lost their edge and even failed to defend the $139-level resistance (previous support). The alt lost over 40.57% (from 10 February) of its value and hit its 13-month low on 24 February.
Since recovering from the $112-$115 range, AAVE broke out of the down-channel (white) and aimed to challenge its resistance. Meanwhile, the Supertrend entered into a green zone by favoring the buyers.
At press time, AAVE was trading at $135.199. The RSI could not sustain itself above the midline after a bearish divergence with price but still showed promising revival signs over the last few hours. Also, the OBV conformed with the recent incline while maintaining its support. But like UNI, AAVE displayed a weak ADX after it took a sharp plunge in the last five days.


![Stacks [STX] crashes to $0.13 even as PoX-5 testnet goes live – Why?](https://ambcrypto.com/wp-content/uploads/2026/07/IMG-20260725-WA0006.jpg)