Polkadot, Uniswap, Ethereum Classic Price Analysis: 08 February

Polkadot was projected to snap fresher highs in the short term before an eventual correction. Uniswap gave mixed signals at the time of writing, and a fall below $17.6 support could mark a downtrend. ETC flashed bullish signs but further impetus could be needed for a rise above the $9 level.
Polkadot [DOT]
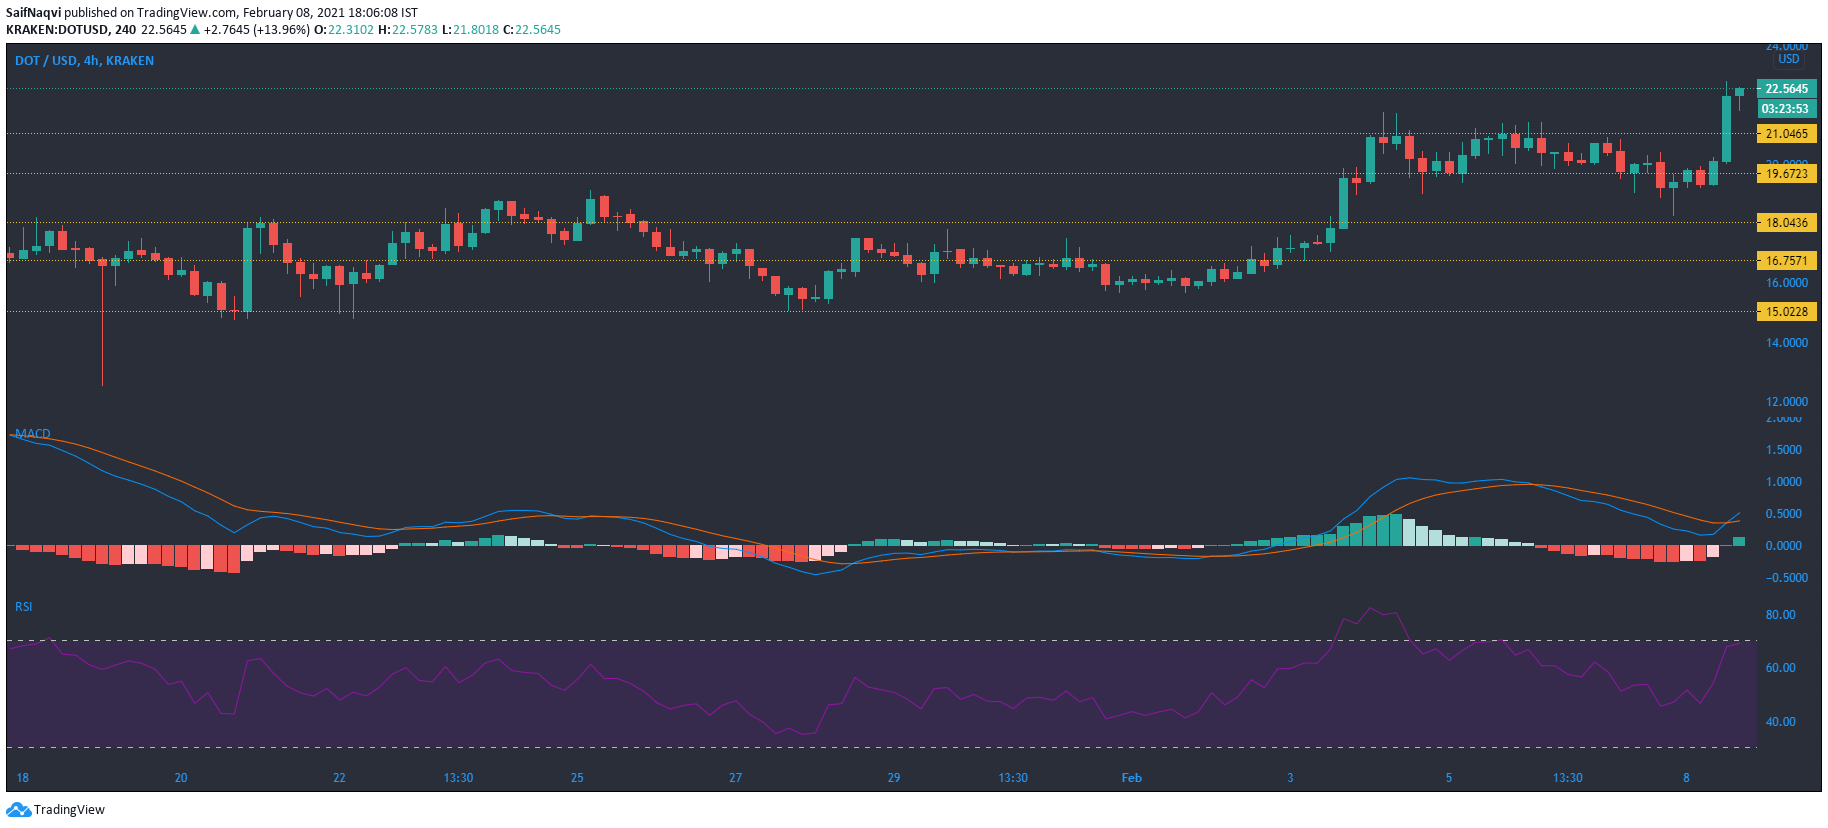
Polkadot invalidated all bearish predictions and snapped yet another all-time high at $22.45 at the time of writing. The recent rally, which was backed by strong buying pressure and healthy volumes, boosted DOT’s market cap to above $19.3 billion and among the top 5 crypto rankings. Considering the strong uptrend over the past 30-days, DOT could likely form newer highs in the coming days.
A bullish crossover on the MACD also backed a favorable outcome for DOT. The Relative Strength Index was not yet at its tipping point and also supported an extended bullish outcome. On the flip side, a bearish scenario could see DOT could move below its 50-SMA (yellow), which would signal a trend reversal in the short-medium term.
Uniswap [UNI]
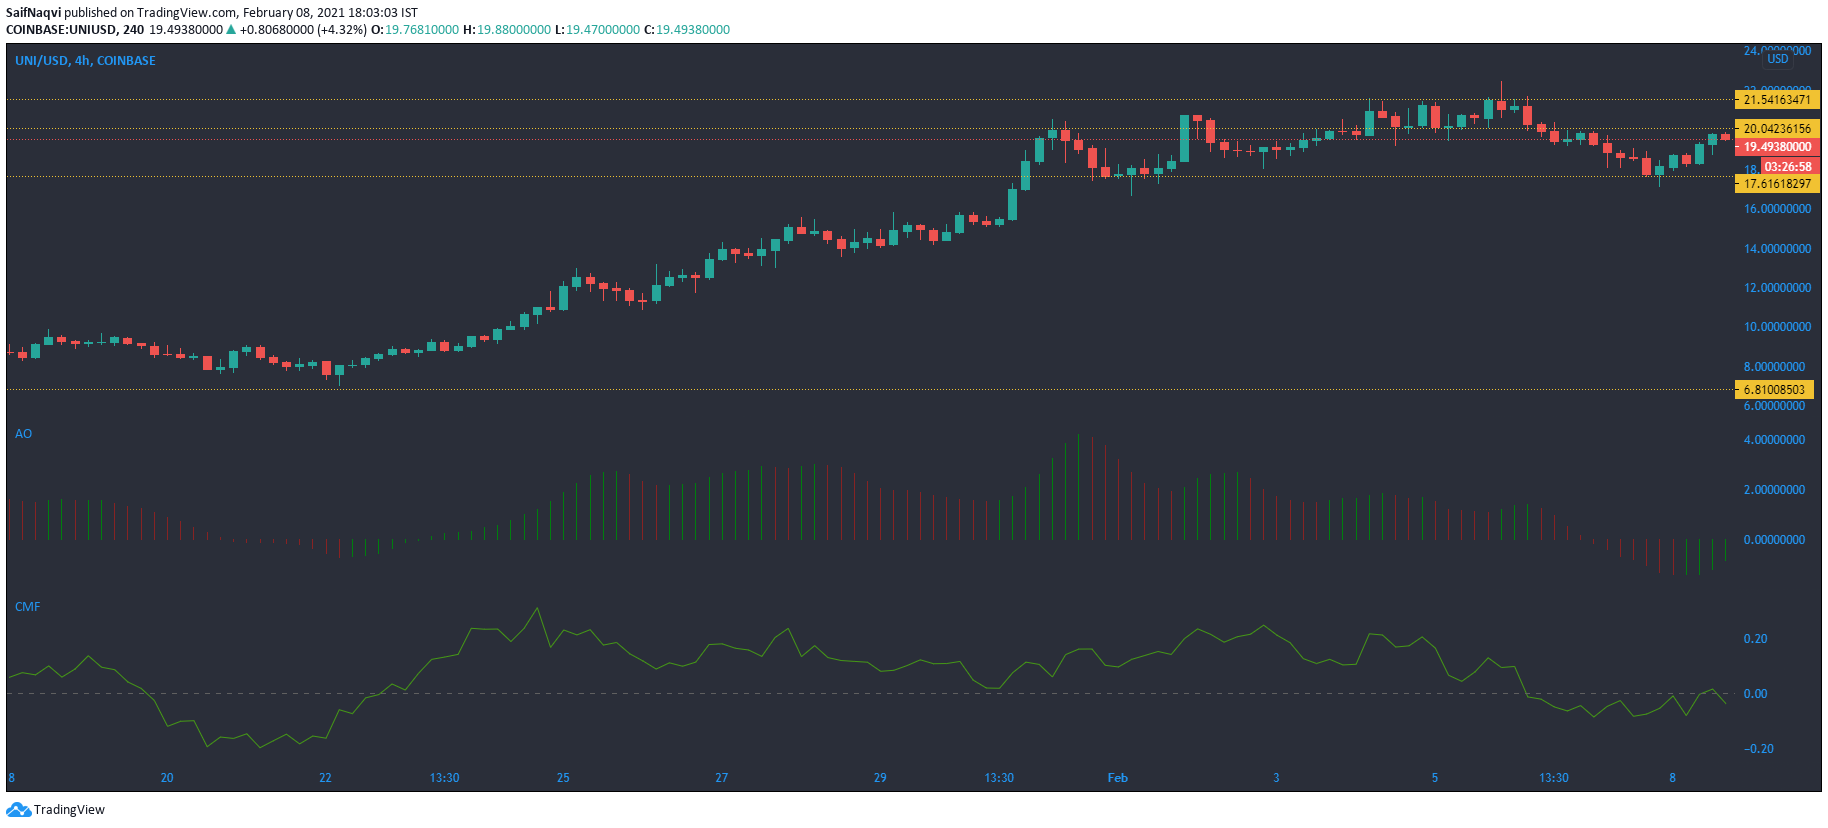
Uniswap bounced back from $17.6 support after the price cooled off from its all-time high. The bullish momentum was captured by the Awesome Oscillator as the bulls targeted $20 resistance. Skepticism in UNI’s market arose from the fact that buying activity and trading volumes were not very noticeable in the last 24 hours.
The Chaikin Money Flow also favored the selling side as the index moved below the half-line. Losing out to the $17.6 support level could lead to a trend reversal and present sell signals for traders.
Ethereum Classic [ETC]
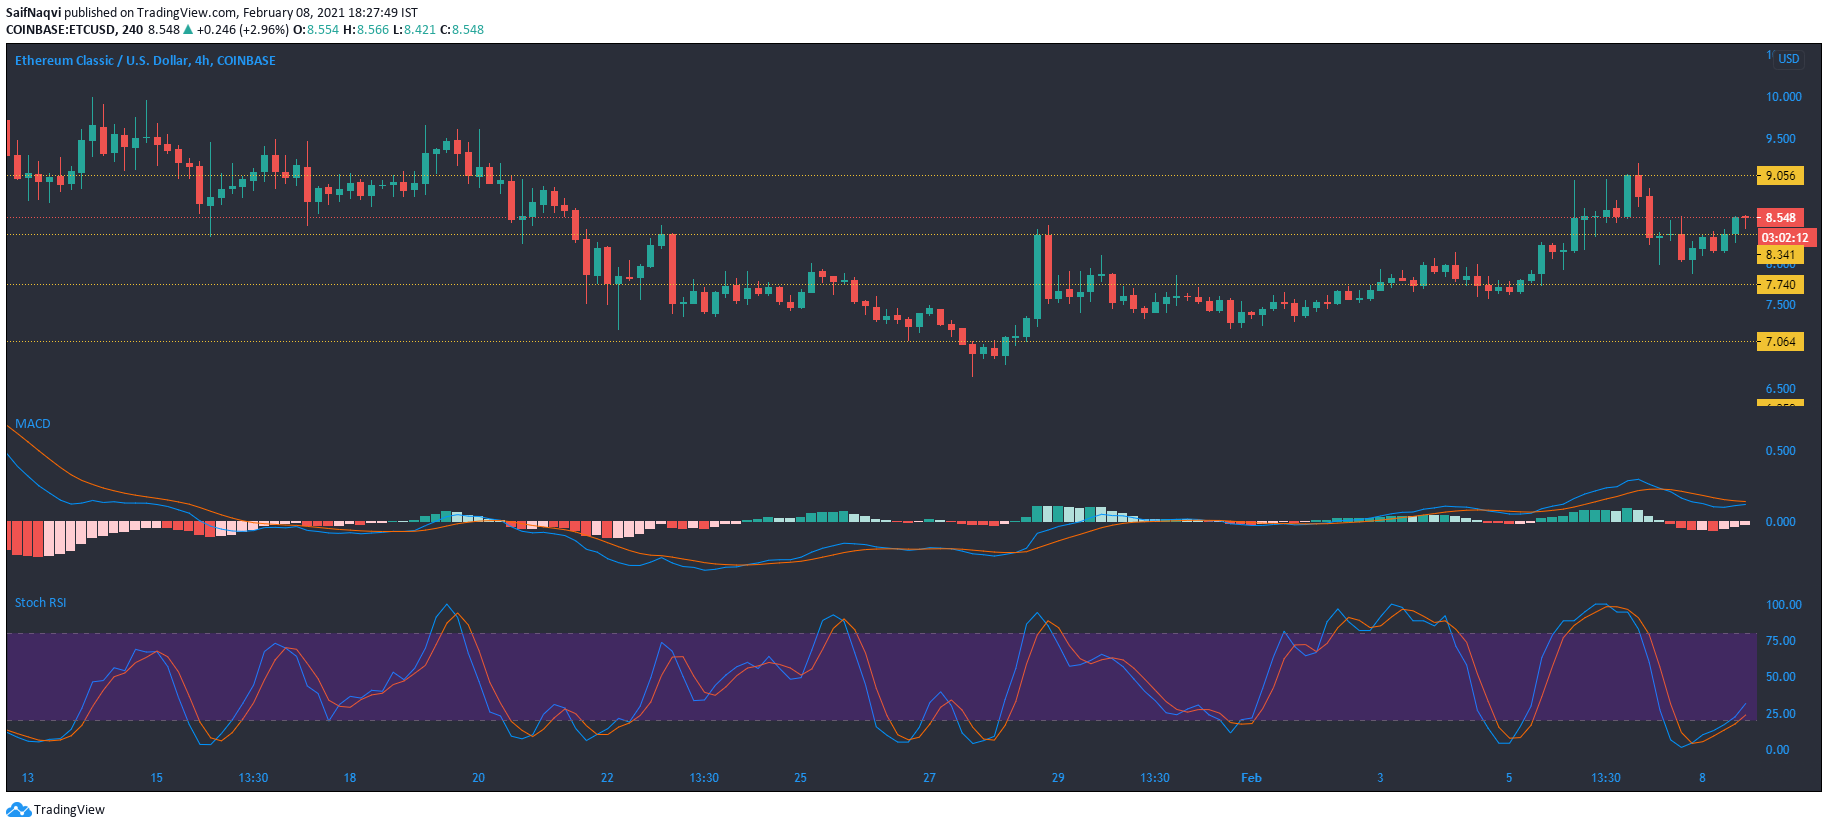
Ethereum Classic flipped $8.34 resistance on the back of strong momentum on the buying side, and the on-chain metrics favored an extended bull run as well. The Stochastic RSI moved northbound after a bullish crossover, while the MACD line eyed a move above the signal line. Despite the bullish prediction, the bears could hold on to the $9 resistance mark and stronger cues from the broader market could be needed for a move above the upper ceiling.
On the other hand, a fall below $7.7 support would indicate the continuation of a bearish market and present some buy signals for long-term traders.