Quant [QNT]: Gauging the after-effects of this pattern’s break to time entries
![Quant [QNT]: Gauging the after-effects of this pattern’s break to time entries](https://ambcrypto.com/wp-content/uploads/2022/11/Untitled-design-21-e1668080504392.png)
Disclaimer: The findings of the following analysis are the sole opinions of the writer and should not be considered investment advice
- Quant’s sway below its EMA ribbons exhibited a heightened selling edge, can the sellers continue to propel losses?
- The altcoin noted a substantial spike in its network growth but its social dominance declined
Quant [QNT] marked an expected fall from its uptrend amidst the broader market pulldown over the last few days. The ongoing losses pulled the coin below its EMA ribbons and the 200 EMA (green).
Read Quant’s [QNT] Price Prediction 2023-24
Should the current rally exhibit rebounding inclinations from its high liquidity zone, QNT could see a near-term revival. At press time, QNT was trading at $112.1, down by 15.83% in the last 24 hours.
QNT marked a patterned breakdown, can the buyers step in soon?
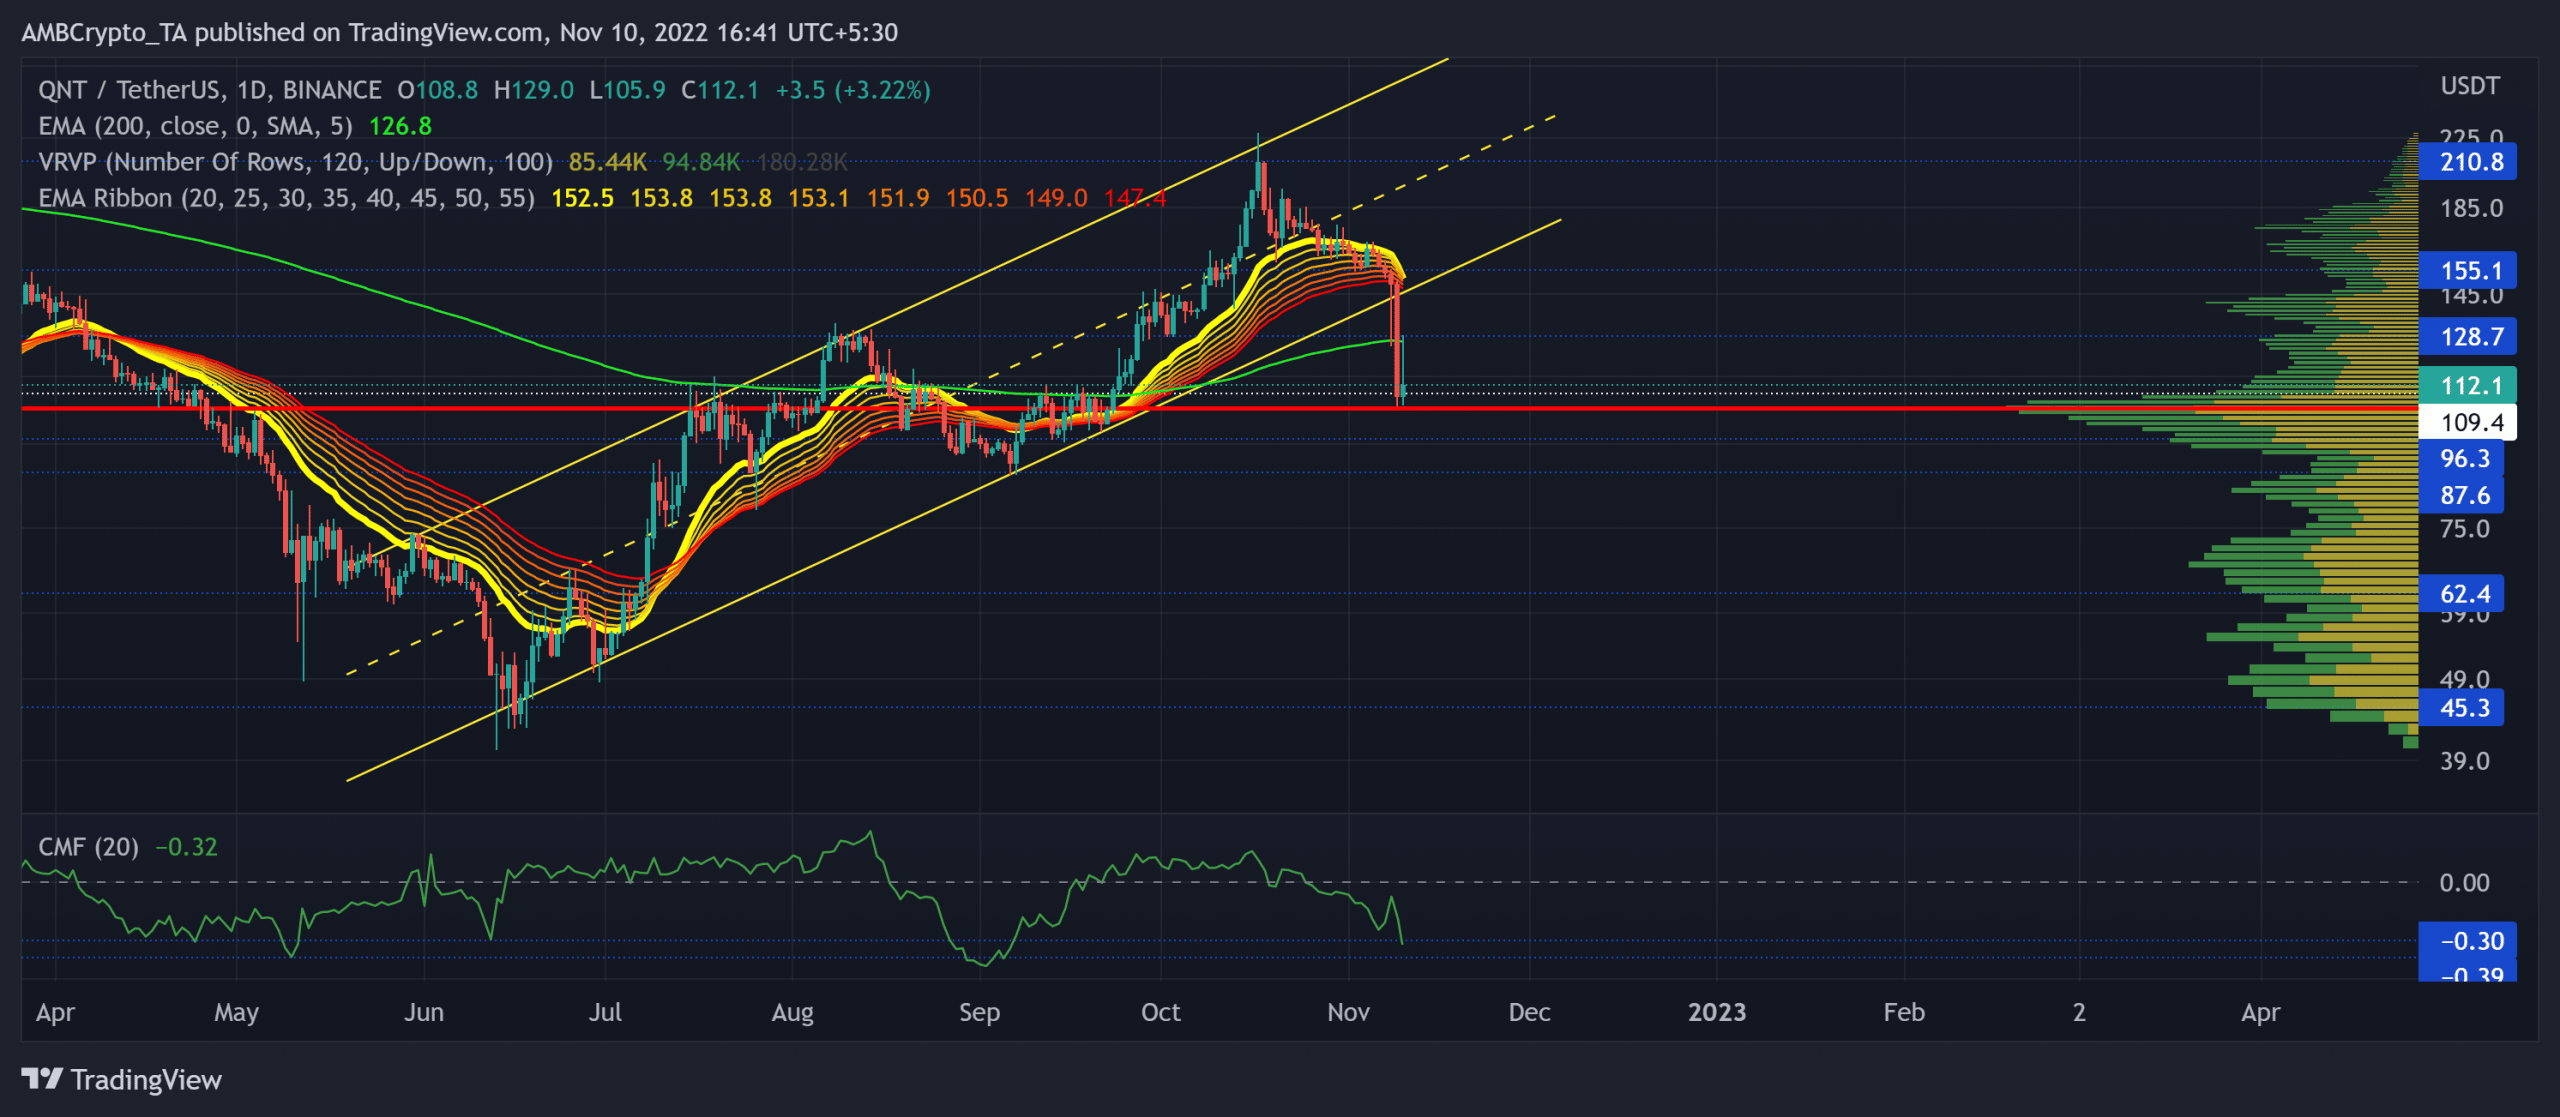
QNT’s mid-June revival from the $45-support challenged the broader market trend by clinching consistent gains. In the meantime, it formed a multi-month ascending channel (yellow) on the daily chart.
After facing bottlenecks near the $210-resistance, QNT bears inflicted a sell-off as the altcoin lost its EMA ribbon support. The resulting decline caused a patterned breakdown below the 200 EMA.
A plausible rebound from the $109-mark near the Point of Control (POC, red) could prevent an immediate bloodbath. While the altcoin did not show high sensitivity to Bitcoin’s sentiment, it revealed a 40% 30-day correlation with Bitcoin.
Given the high liquidity zone near the POC, the buyers could protect the immediate support. In such a case, the sellers would look to pose barriers near the 200 EMA in the $128-region.
However, should the buyers dwindle and fail to protect the POC level, QNT bears would look to expedite their pressure and look for a test of the $96-$90 range in the coming sessions.
The Chaikin Money Flow (CMF) declined below the zero-mark after the altcoin’s U-turn from the $210-ceiling. Buyers should look for a potential rebound from the -0.3 to -0.39 range to assess a turnaround potential on the charts.
Social Dominance and Network Growth pointed to…
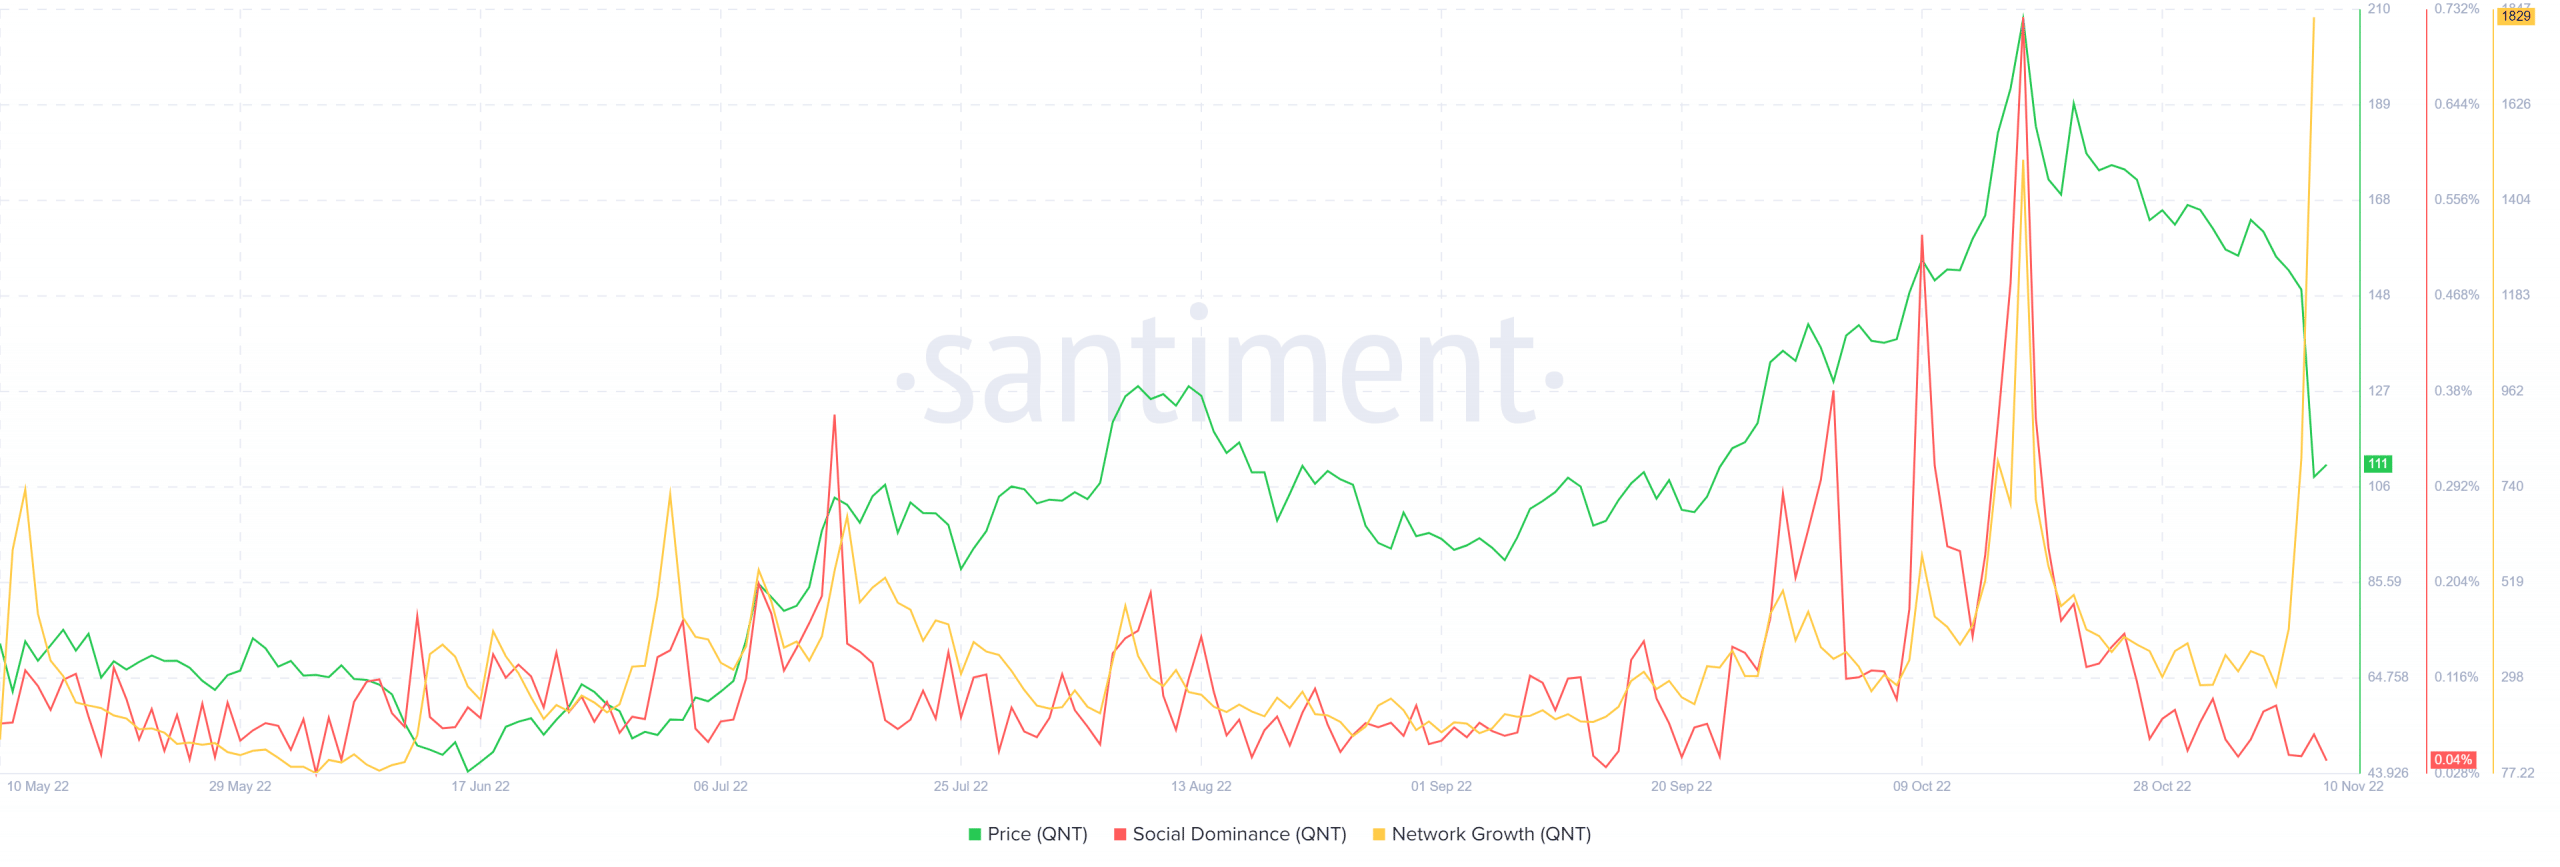
An analysis of data from Santiment revealed a robust spike in QNT’s network growth over the last four days. However, its social dominance continued to look decline from its mid-October highs.
While the price action seemed relatively sensitive to them, the price action also marked a corresponding decline. Buyers should keep a close watch on these metrics to gauge the underlying sentiment toward the crypto. Finally, keeping a watch on the king coin’s movement could help make a profitable bet.