Reasons why Ethereum traders may witness short-term gains this weekend

Ethereum [ETH], at the time of writing, was exchanging hands at $1,341. As of 22 September, the alt concluded a 30% retracement from its September high of $1,789. A far cry from what many investors expected from its most important month of the year. On the bright side, the alt was trading at a steeper discount and flashing recovery rally signs.
ETH may not have retested its 2022 lows but the 30% discount did push it back to mid-July levels. Another 30% drop will certainly trigger that YTD low retest. Although another crash was still a possibility, ETH’s latest performance suggested that a short-term bullish retracement was in the works.
Feeding the bulls
A 30% discount within the last two weeks was large enough to attract a lot of attention and potential accumulation. ETH exchange outflows registered a sizable increase in outflows. This was the largest outflow registered since mid-June.
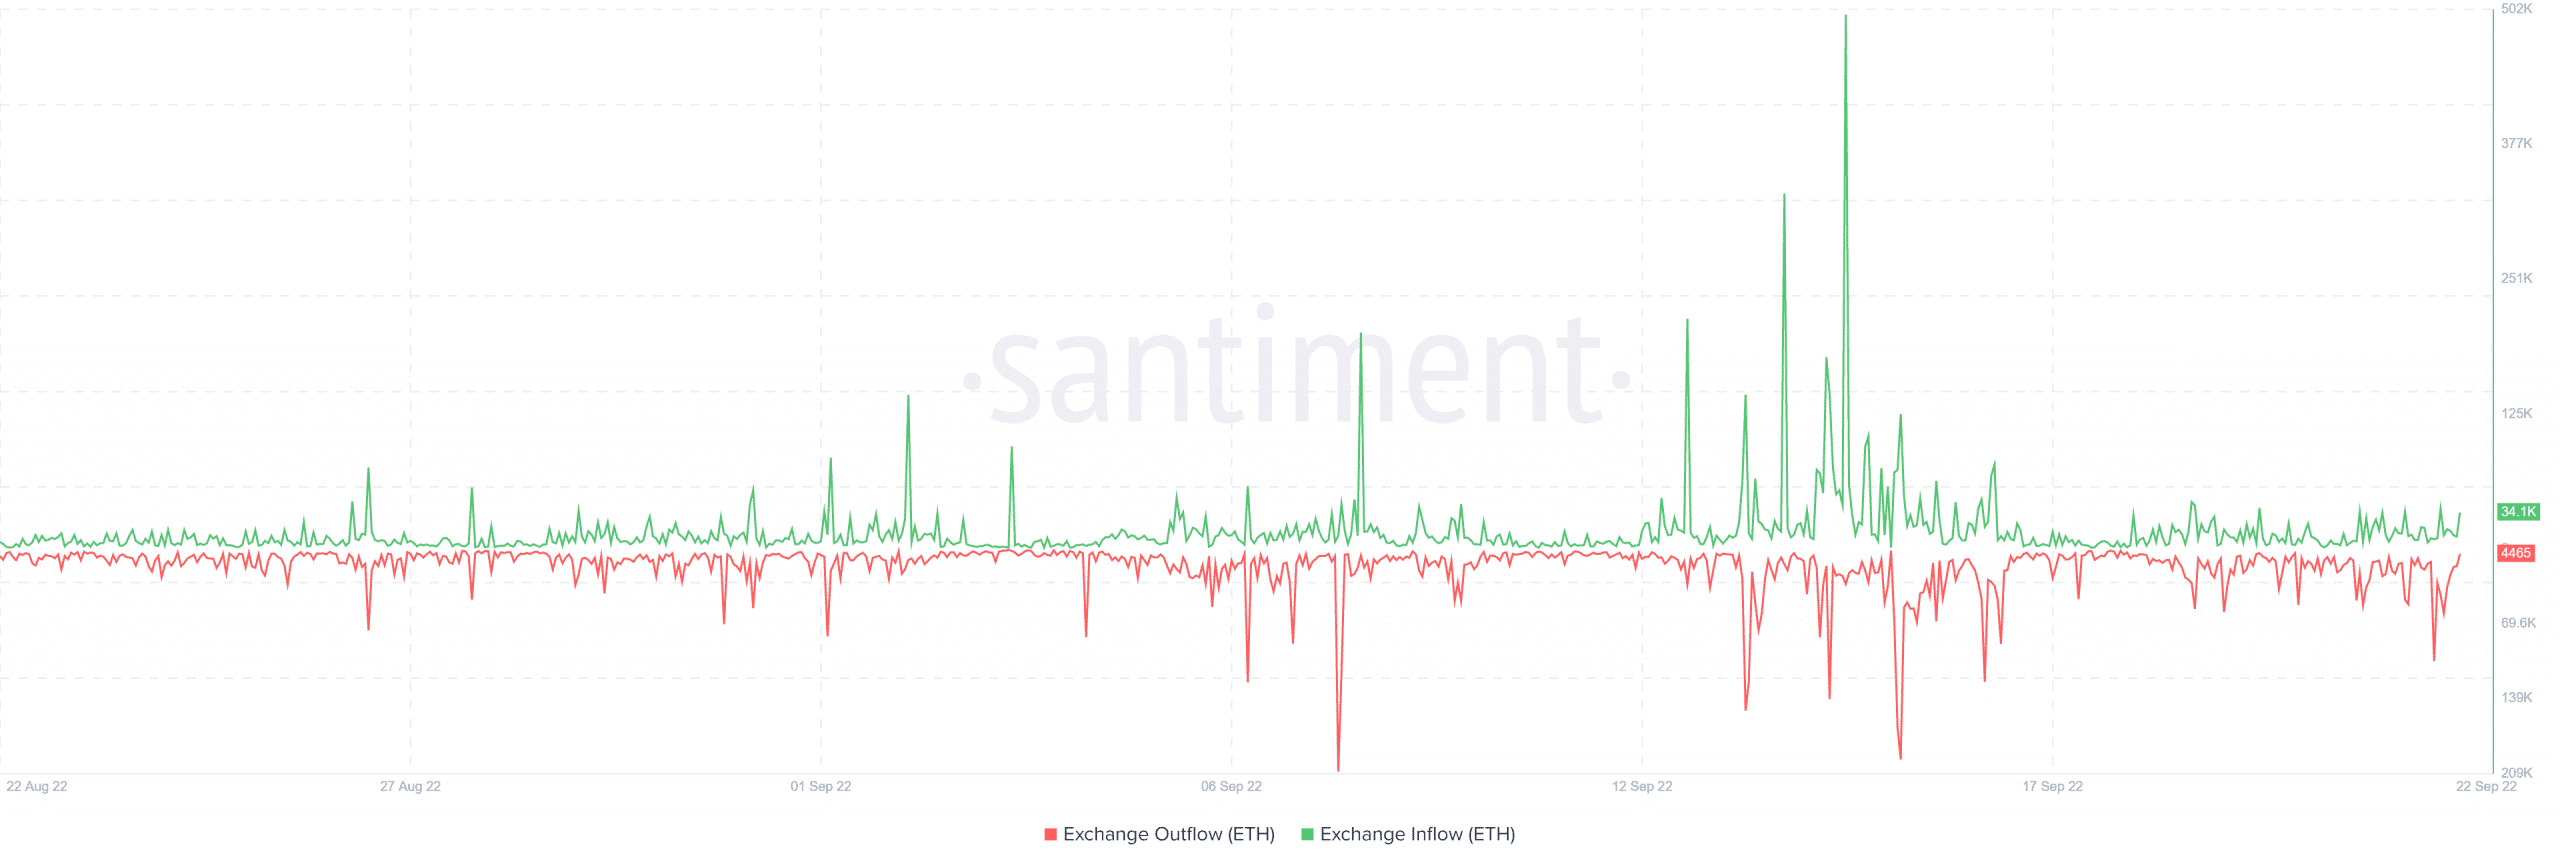
Roughly 104,000 ETH flew out of exchanges between 21 and 22 September. This equated to roughly $132 million in buying pressure. In contrast, roughly 18,000 ETH was deposited onto exchanges during the same period. Exchange outflows far outweighed the amount of inflows, thus confirming a strong demand uptick.
ETH’s 180-day Market Value Realized Value (MVRV) ratio took a dive since 10 September, around the same time that the price tanked. This confirmed that most people who held ETH at the time, especially those that bought pre-Merge are out of money. However, the same metric registered a slight uptick in the last two days.
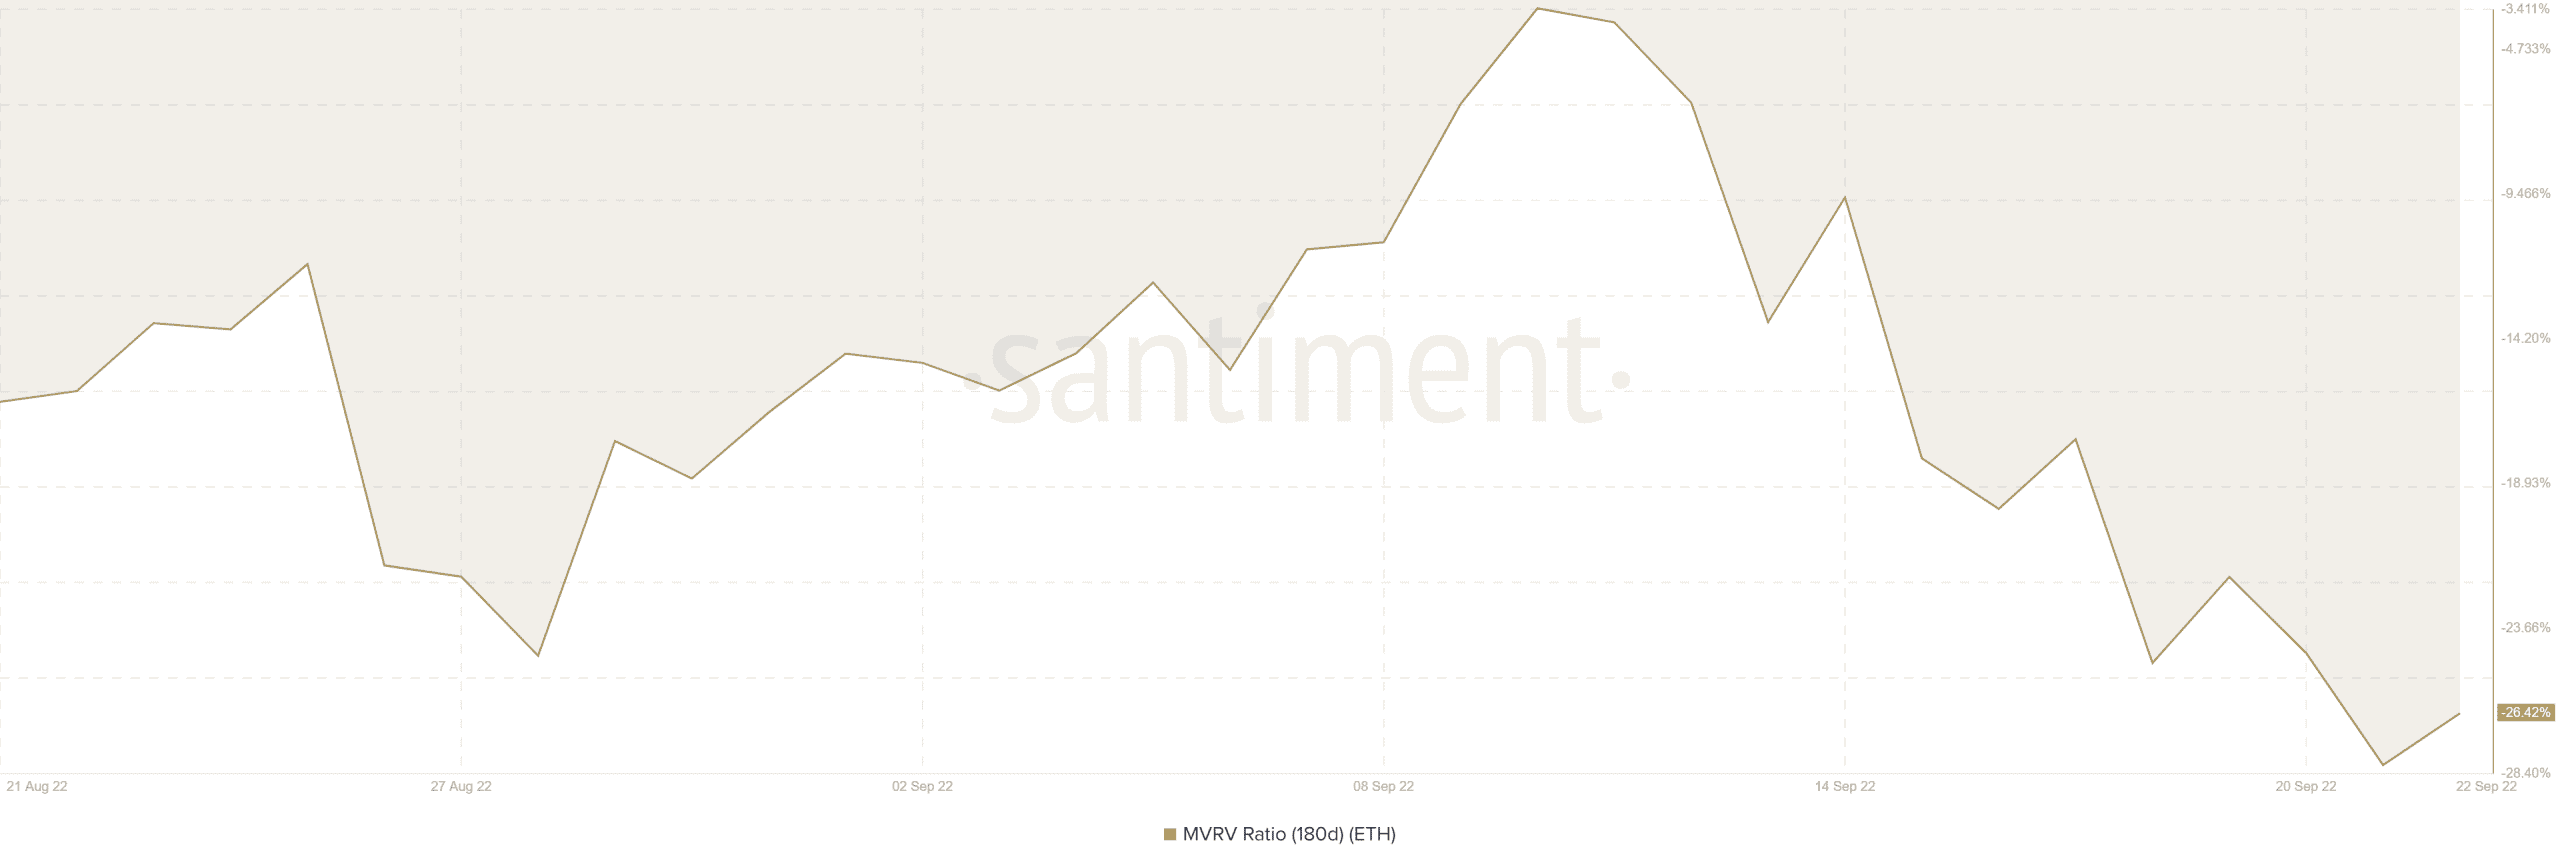
The MVRV’s pivot in the on 21 September confirmed an increase in the level of demand near the current lows. It also reflected higher outflows from exchanges observed in the exchange outflow vs. inflow metrics.
ETH’s price action and indicators also cemented the short-term bullish expectations. ETH’s six-hour chart revealed a strong bearish candle towards the end of 21 September’s trading session. The pullback pushed the price lower than its previous low a day prior. Despite this outcome, the Relative Strength Index (RSI) registered a higher low compared to its previous high.
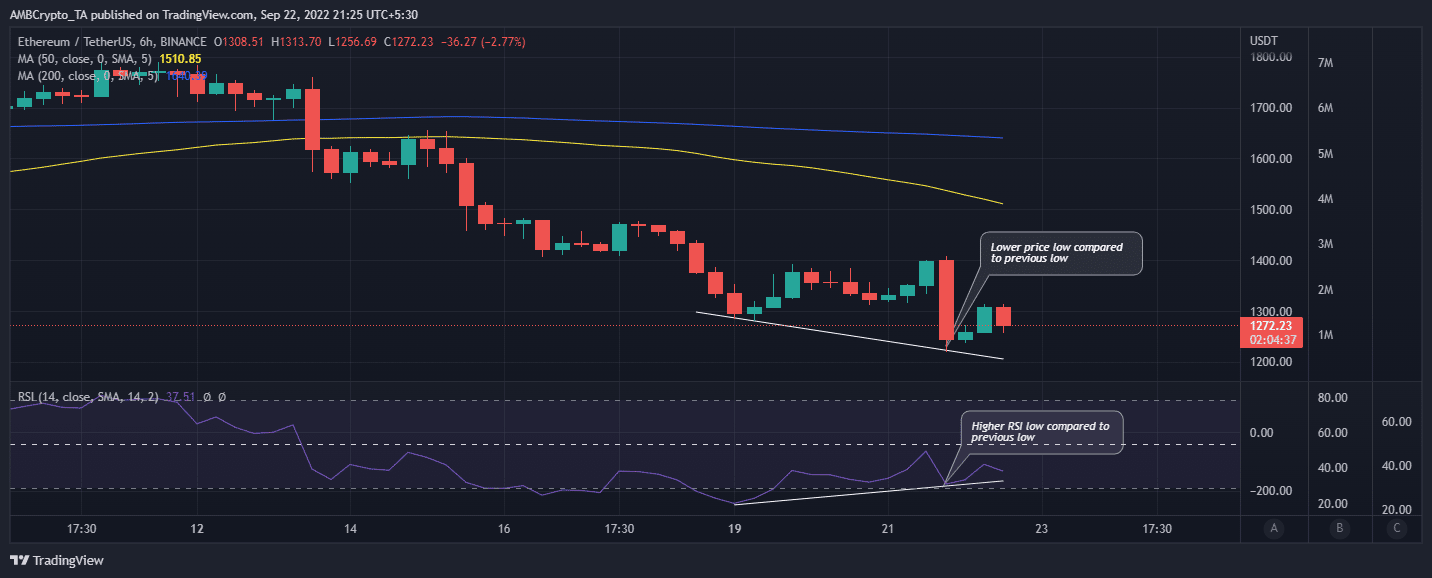
The above outcome underscored a price to RSI divergence. This is often considered a bullish outcome and could be a sign that ETH is headed for a bullish weekend.
Furthermore, ETH’s on-chain metrics combined with the price action reinforced ETH’s short-term bullish potential. Investors should still take note that ETH wasn’t oversold yet despite the latest downside. Hence, a potential for a further downslide below current levels still exists.


