SAND holders could witness a profit-seeking opportunity, only if…

The November rally bagged in staggering gains as SAND attained its ATH on 25 November. But since then, it has been in a retracement phase as it depreciated in a descending channel (yellow).
Subsequently, a forceful close below its Point of Control (red) would position SAND for the test of $2.2-support before the bulls attempt a rally toward the $2.7-$3.2 range. At press time, SAND traded at $2.7036, down by 16.5% in the last 24 hours.
SAND Daily Chart
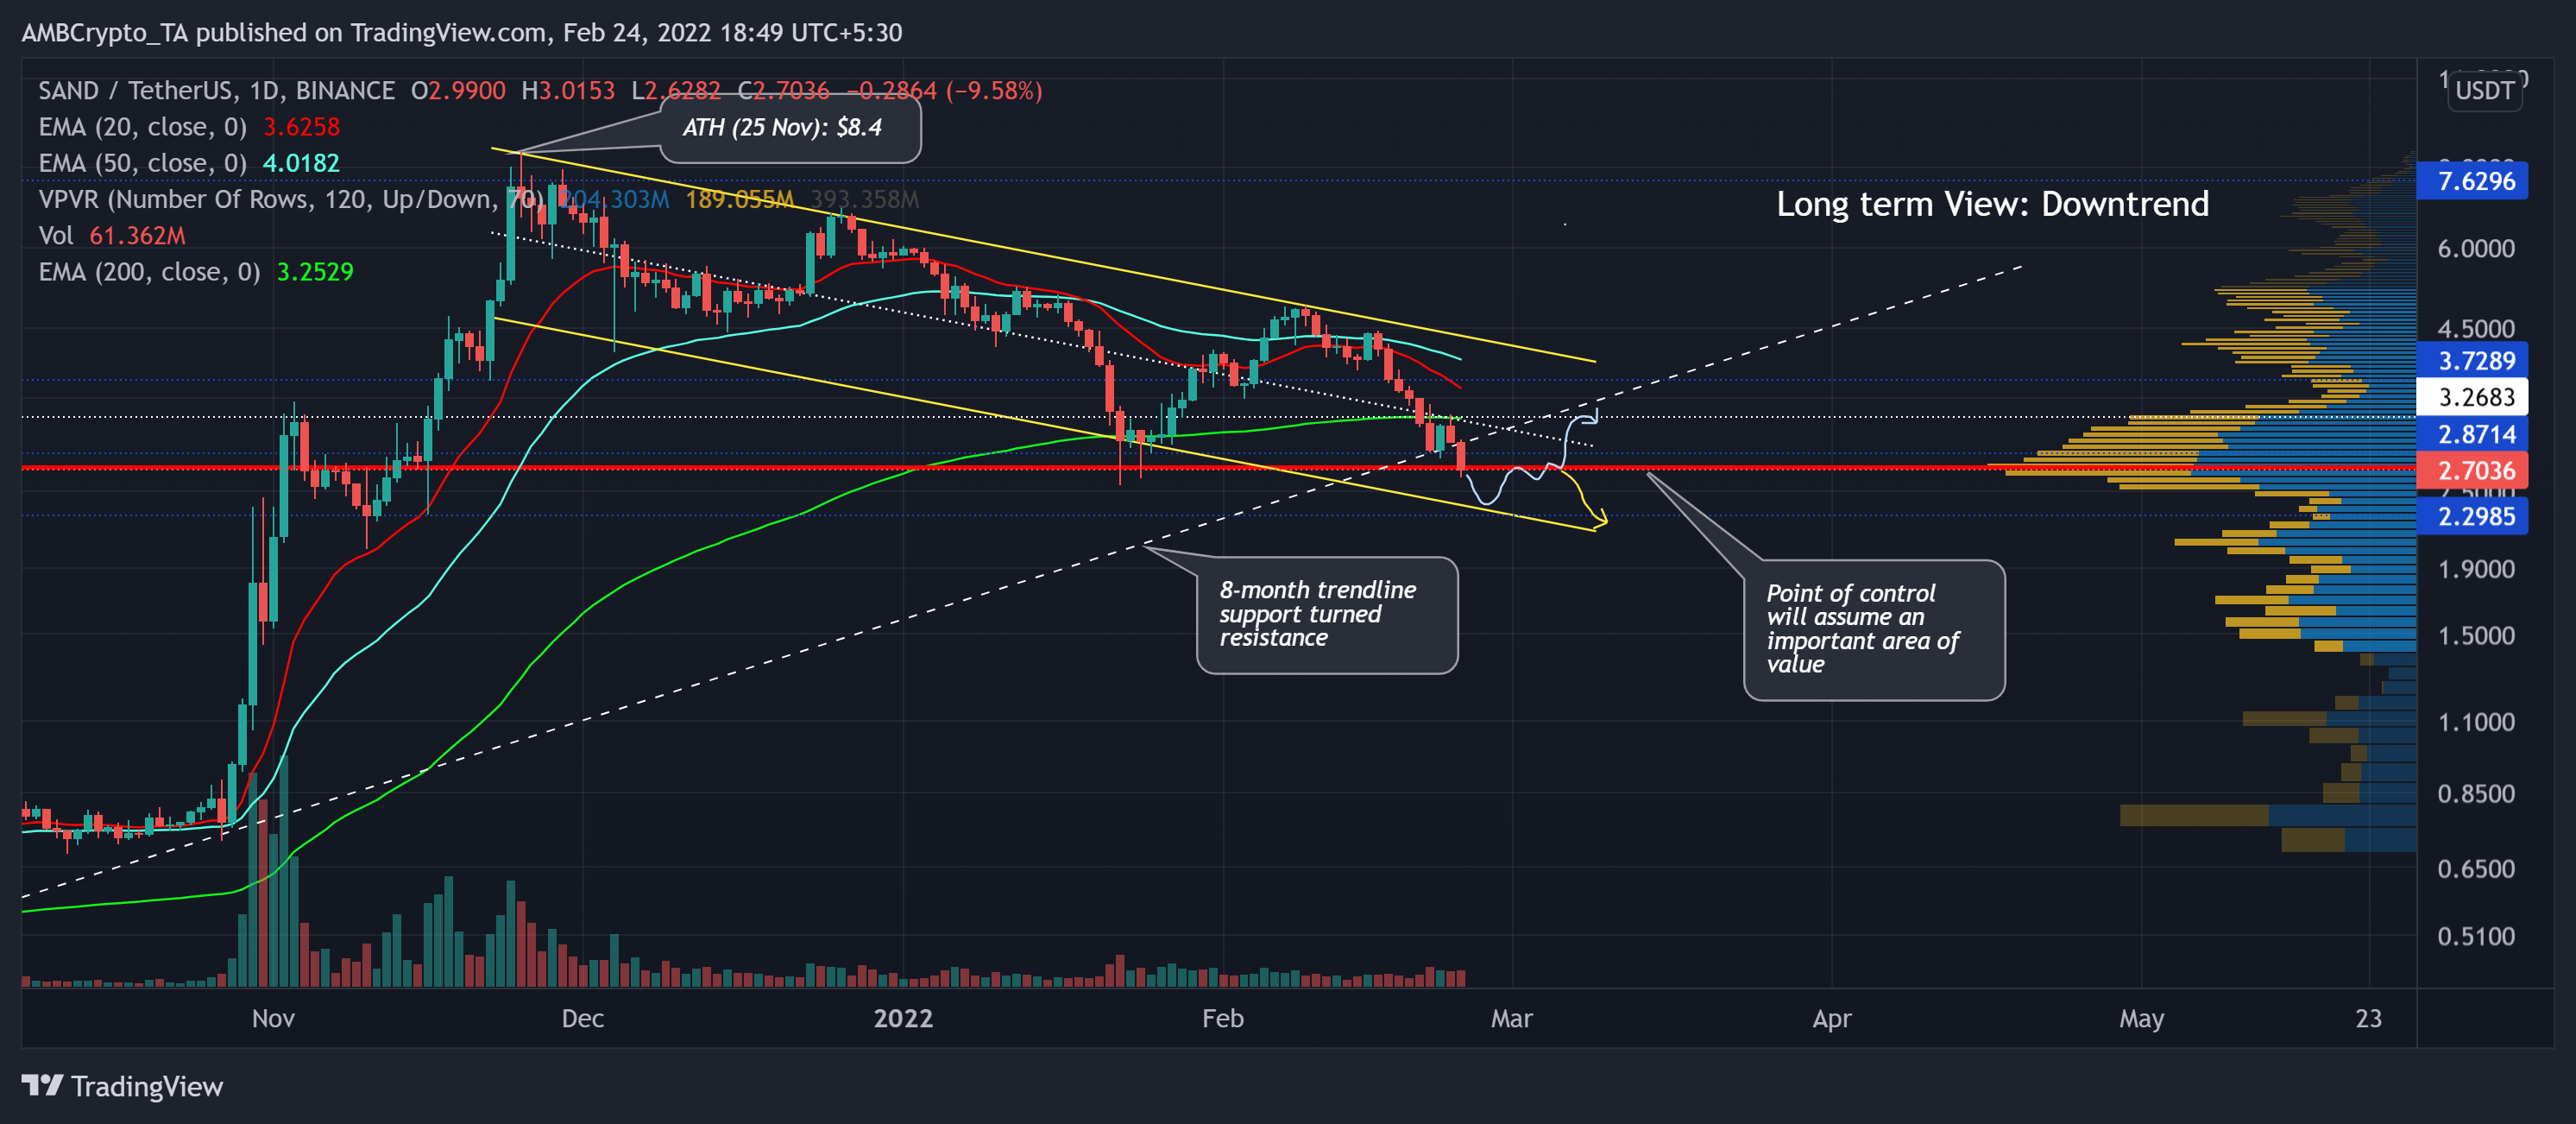
Since its ATH, the alt has declined by over 69% and gravitated towards its November lows on 24 February. During this phase, SAND fell below its 200 EMA (green) for the first time since July 2021 while flipping its eight-month trendline (white, dashed) support to resistance. Historically it showed a strong revival from the above trendline, but the recent sell-offs have strongly established a bearish edge.
The downfall led the coin to lose the crucial $2.8-mark that reaffirmed the vigor of the current downtrend. As a result, it now hovered around its four-month Point of Control (POC, red) at the $2.7-level. Considering the overall sentiment and the technical indications, further sell-offs would find a testing floor near the $2.2-zone.
This zone also coincided with the lower trendline of its long-term down-channel. A potential reversal from this level would brace SAND for friction between the buyers and sellers at its Point of Control before testing the $3.2-resistance.
Rationale
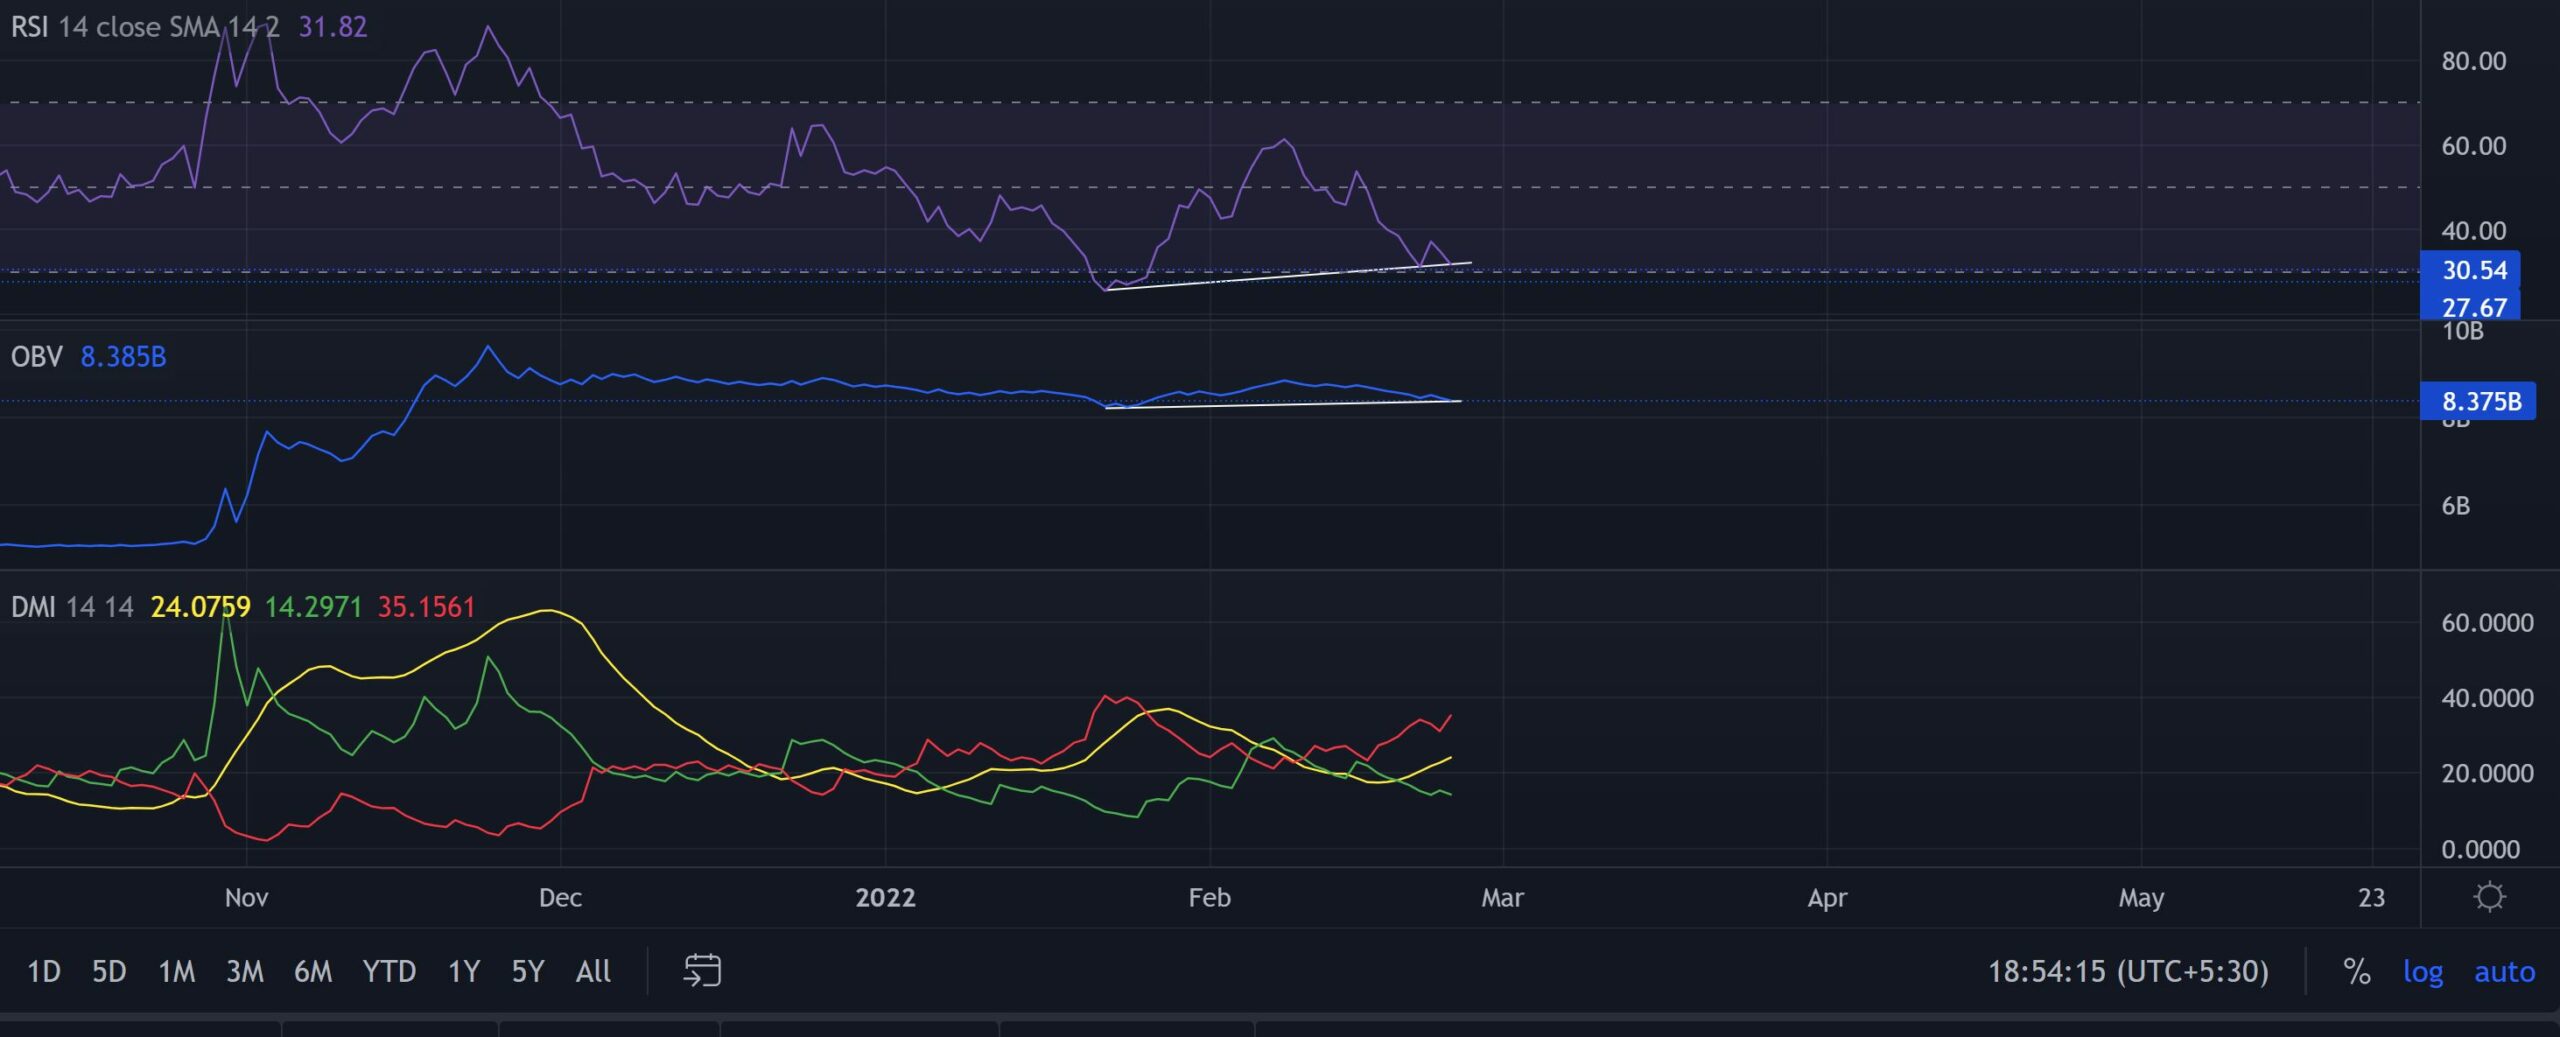
The RSI was on the brink of the oversold mark and undeniably favored the sellers. The 27-30 range support could keep up the revival hopes alive towards the $3.2-level in the days to come. Since the past month, the price has been marking lower troughs while RSI has been on a slight uptrend. So any revival/green candlestick would affirm a bullish divergence from here on.
Like RSI, the OBV confirmed the slight uptrend while the price pulled back. But -DI still looked north, justifying the near-term bearish movements before a reversal.
Conclusion
While the readings on the RSI and OBV potentially hint at stalling the sell-off situation, the buyers still needed to step in and confirm these divergences. Keeping in mind the current selling spree, a touchdown toward $2.2 before a reversal should not be a surprise.
Besides, the alt shares an 80% 30-day correlation with the king coin. Thus, keeping an eye on Bitcoin’s movement would be vital to complement these technical factors.