SAND traders should follow this course of action to avoid losses

The buyers have finally clinched a string of higher troughs for over two weeks for the first time in two months on the 4-hour timeframe. Meanwhile, SAND refrained from high volatility as it hovered near the Point of Control (POC, red) in its high liquidity zone.
Now, as the market players could aim to break the tight phase, the SAND’s chart had quite a few things in store for the coming times.
Any drop below the lower trendline of the broadening wedge would position the alt for a near-term setback before a bullish comeback. At press time, SAND traded at $1.2743, down by 1.76% in the last 24 hours.
SAND 4-hour Chart
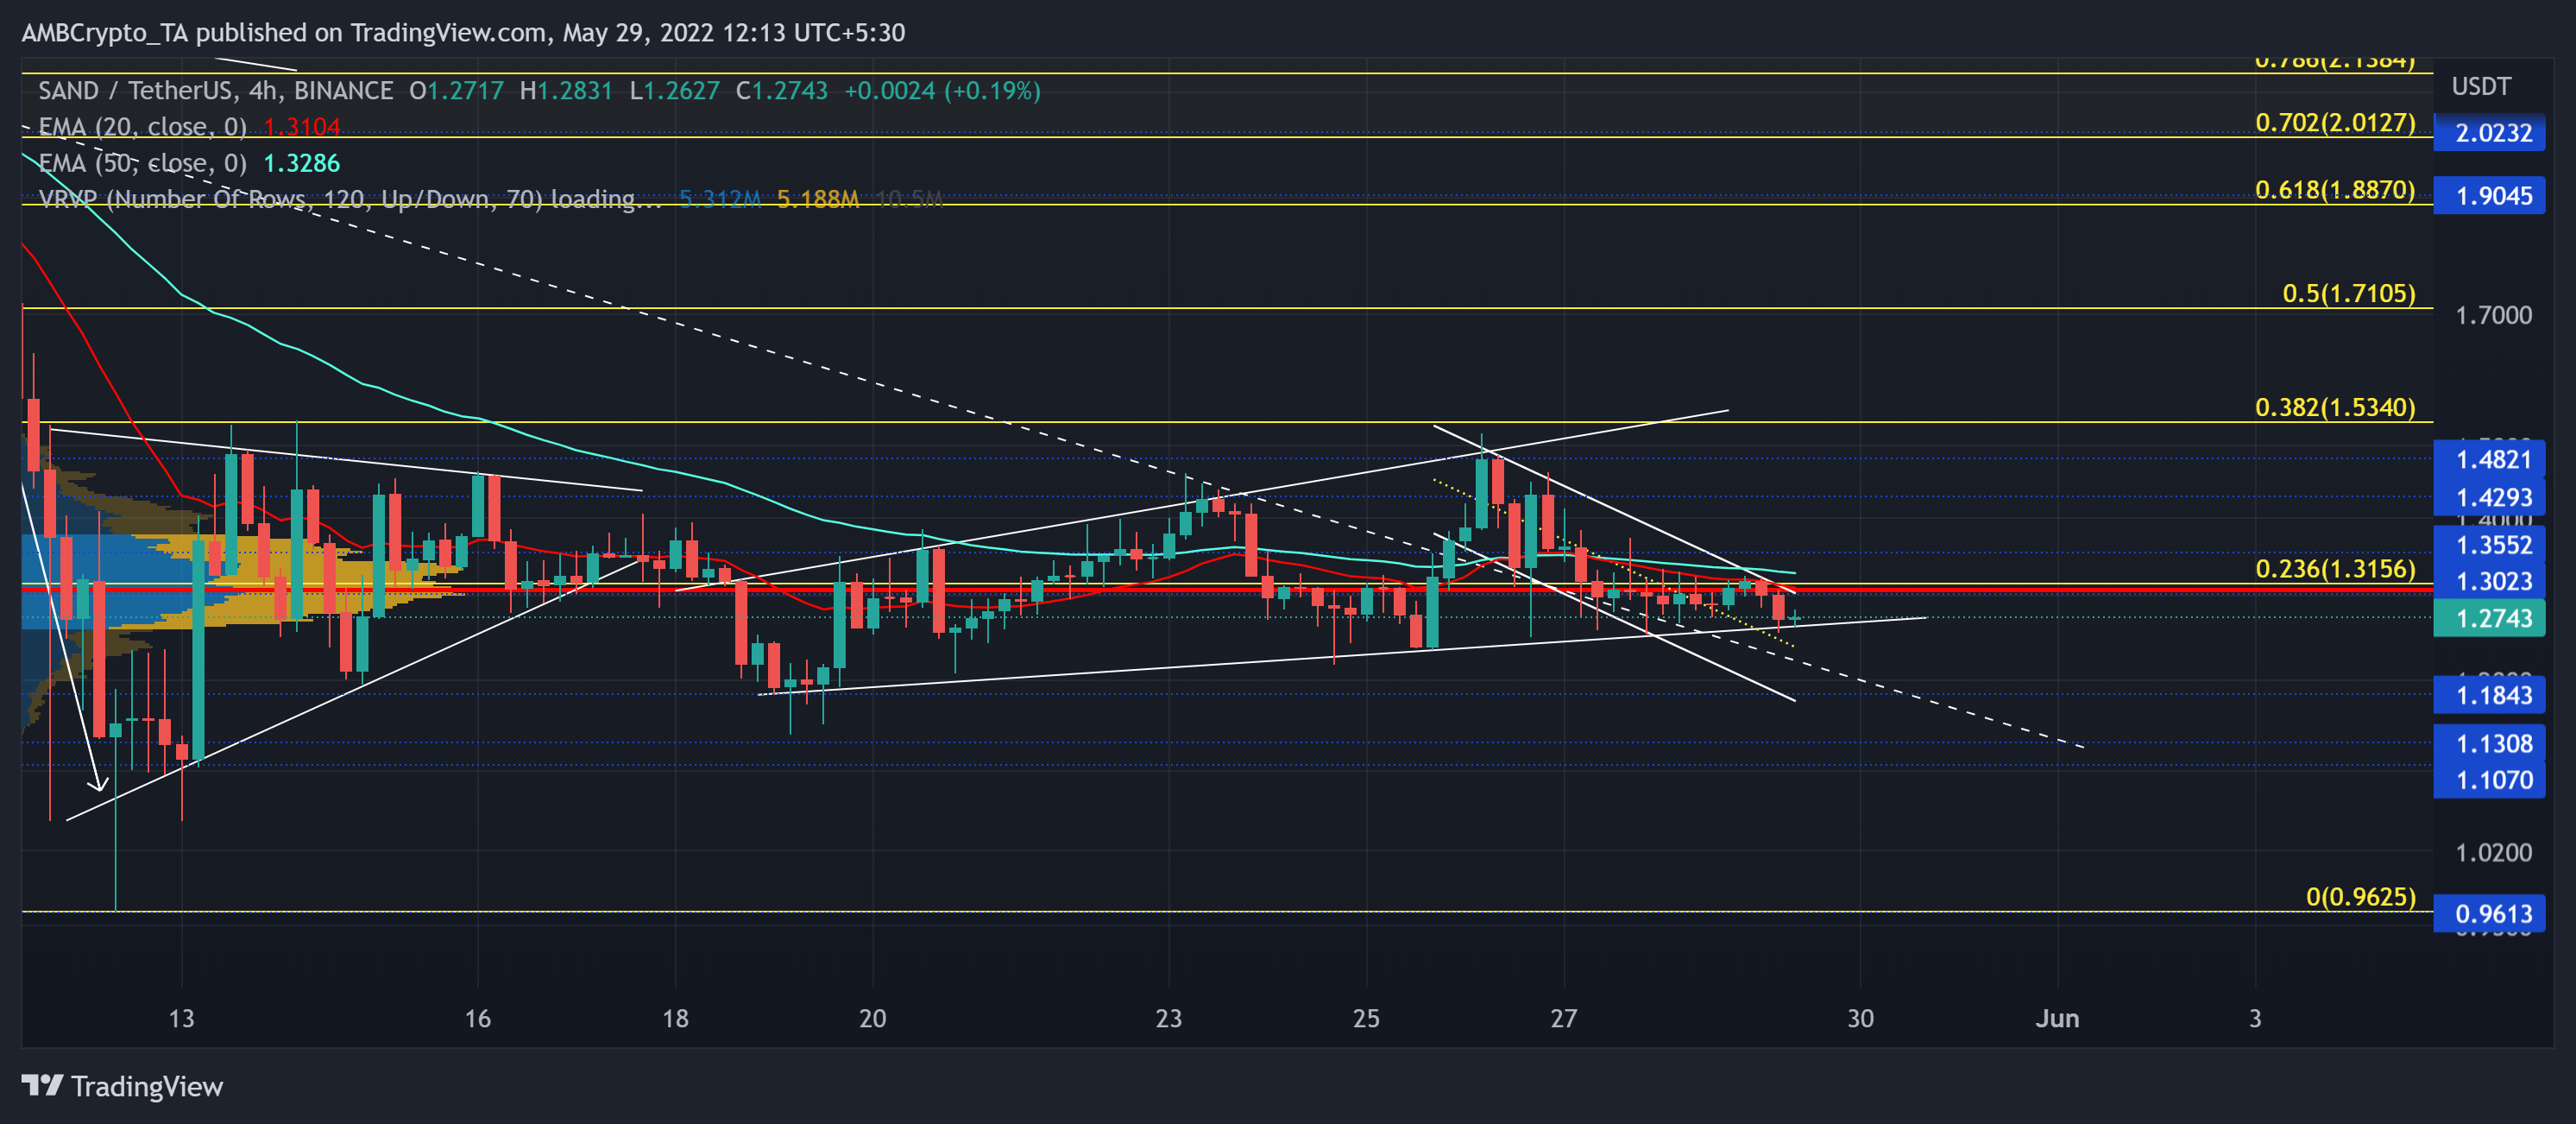
In the wake of broader market liquidations, SAND sellers found renewed thrust from its mid-April highs. On its southbound journey, the trendline resistance (now support, white/dashed) stood as an important area of value.
A nearly 61.3% drop (from 5 May) pulled the coin toward its six-month low on 12 May. Since picking itself from the $1.13 baseline, the altcoin curbed its volatility and transposed in a two-week compression. Meanwhile, the buyers struggled to find a sustainable close beyond the 20 EMA (red).
With an ascending broadening wedge setup, the buyers finally managed to flip the trendline resistance to support. But with the 20 EMA refusing to take a bullish crossover with the 50 EMA (cyan), the buyers would likely face a tough time pulling off a trend modifying rally.
A potential break below the wedge could lead SAND to test the $1.18-zone before the buyers step in to provoke a rally. A bounce back from this level could potentially serve as an entry trigger.
Rationale
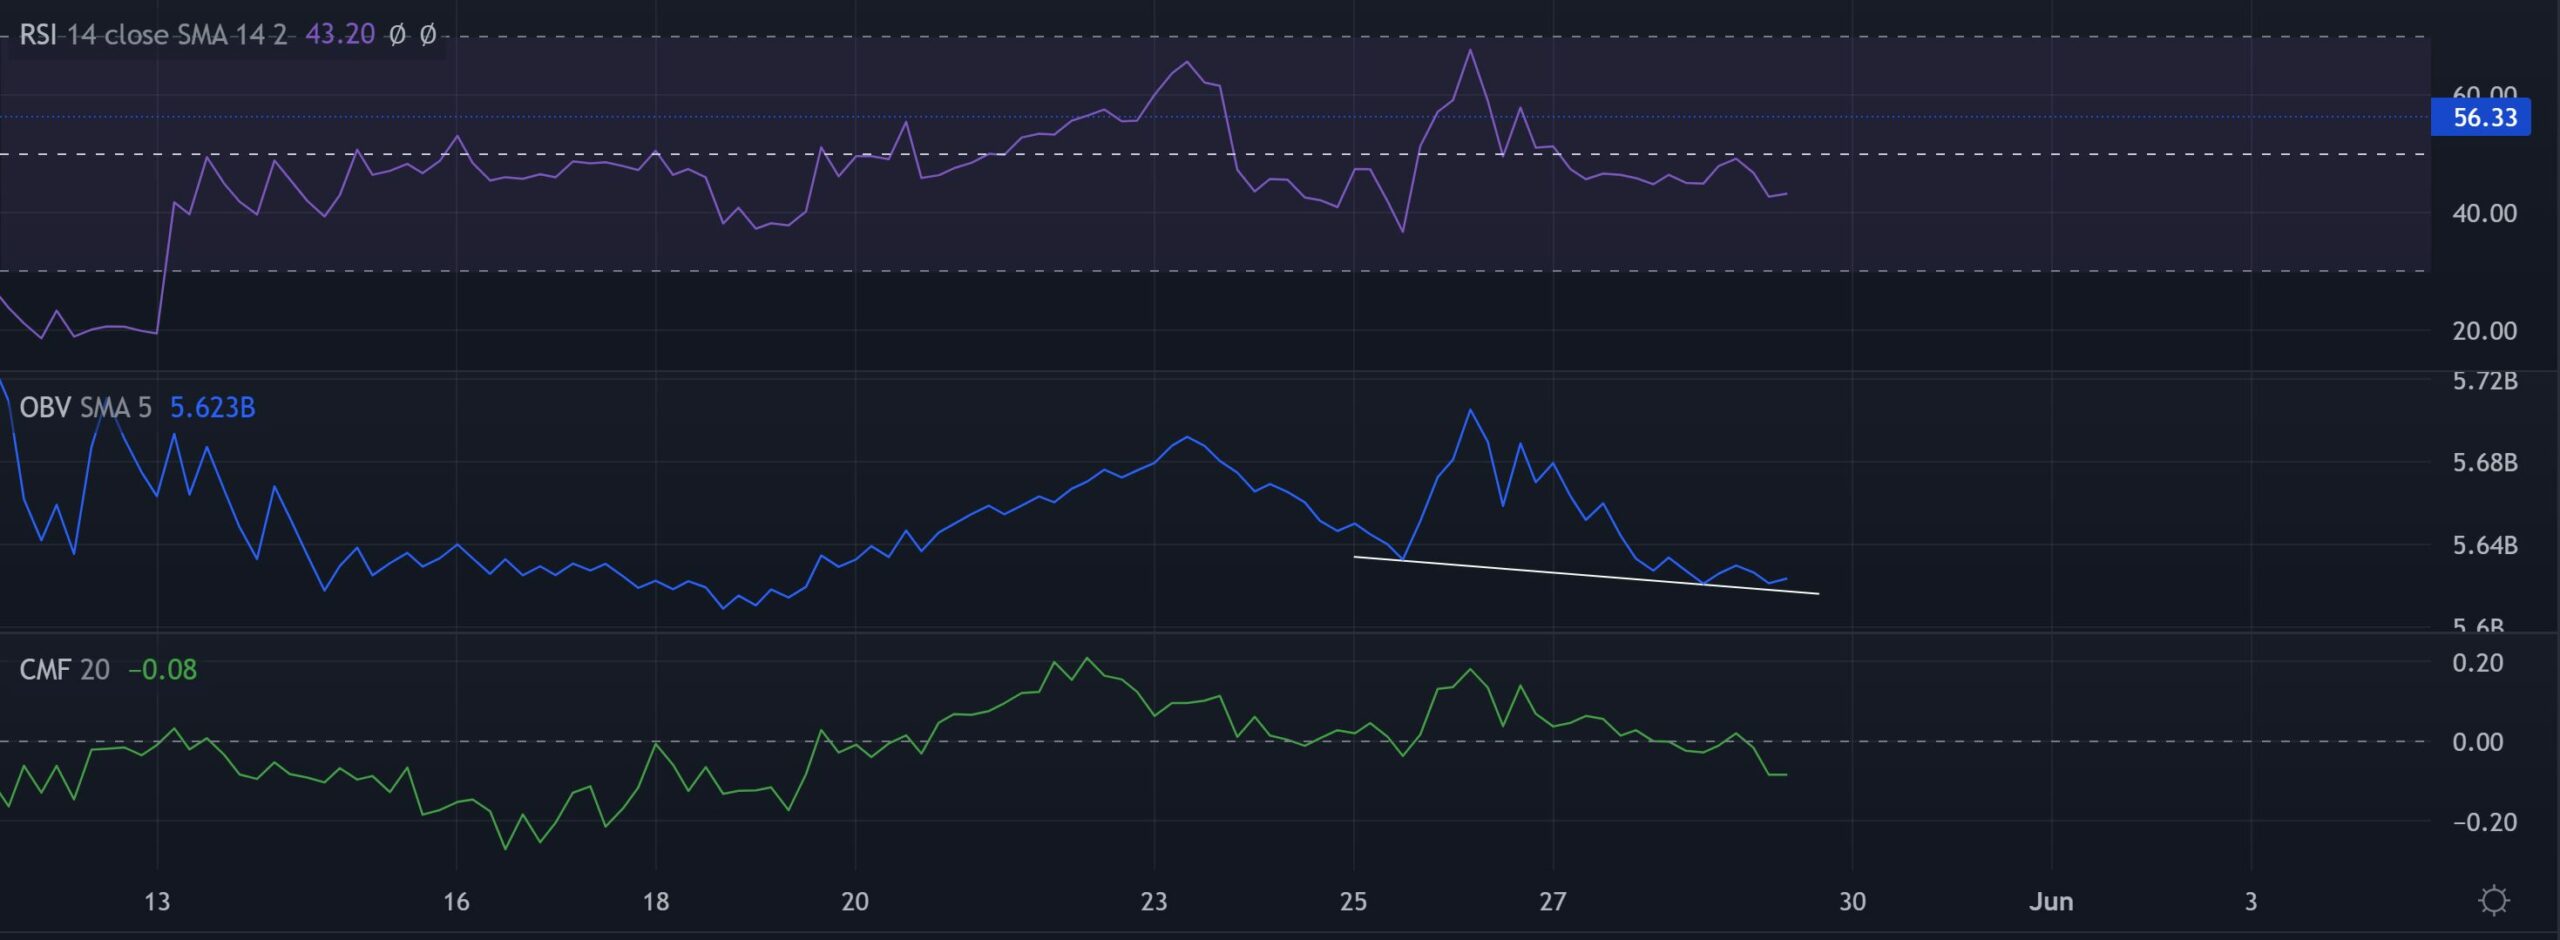
The Relative Strength Index indicated that sellers have a slight edge in the current structure. But the bullish divergence on the OBV kept a near-term bullish comeback hope alive.
To break the chains of 23.6% and break the squeeze phase, the CMF still needed to find a close beyond the zero-line to sustain a rally.
Conclusion
The current setup was quite fragile for SAND. Should the sellers continue to press more, any close below the wedge could lead the alt to lose 6-7% of its value toward the $1.18-zone.
However, with the OBV chalking out a bullish divergence on the 4-hour timeframe, an immediate recovery above the existing down-channel could extend the squeeze phase before a trend-altering move.
Finally, the alt shares a staggering 97% 30-day correlation with the king coin. Hence, keeping an eye on Bitcoin’s movement would be vital to complement these technical factors.


