Shiba Inu falls back to long term support level, is there any recovery in sight
A week prior to press time, Shiba Inu appeared, for a brief moment, to reclaim a critical demand area. The price rallied nearly 23% in a few days. However, it faced rejection and dropped back toward those lows. This price action can be common, as price chops and churns around a pivotal point on the charts.
In a previous article, it was noted that Shiba Inu could see some consolidation and accumulation at these levels. That continued to be the case. Note that prices are represented as 1000x their current value for the sake of clarity and to reduce the number of decimal places.
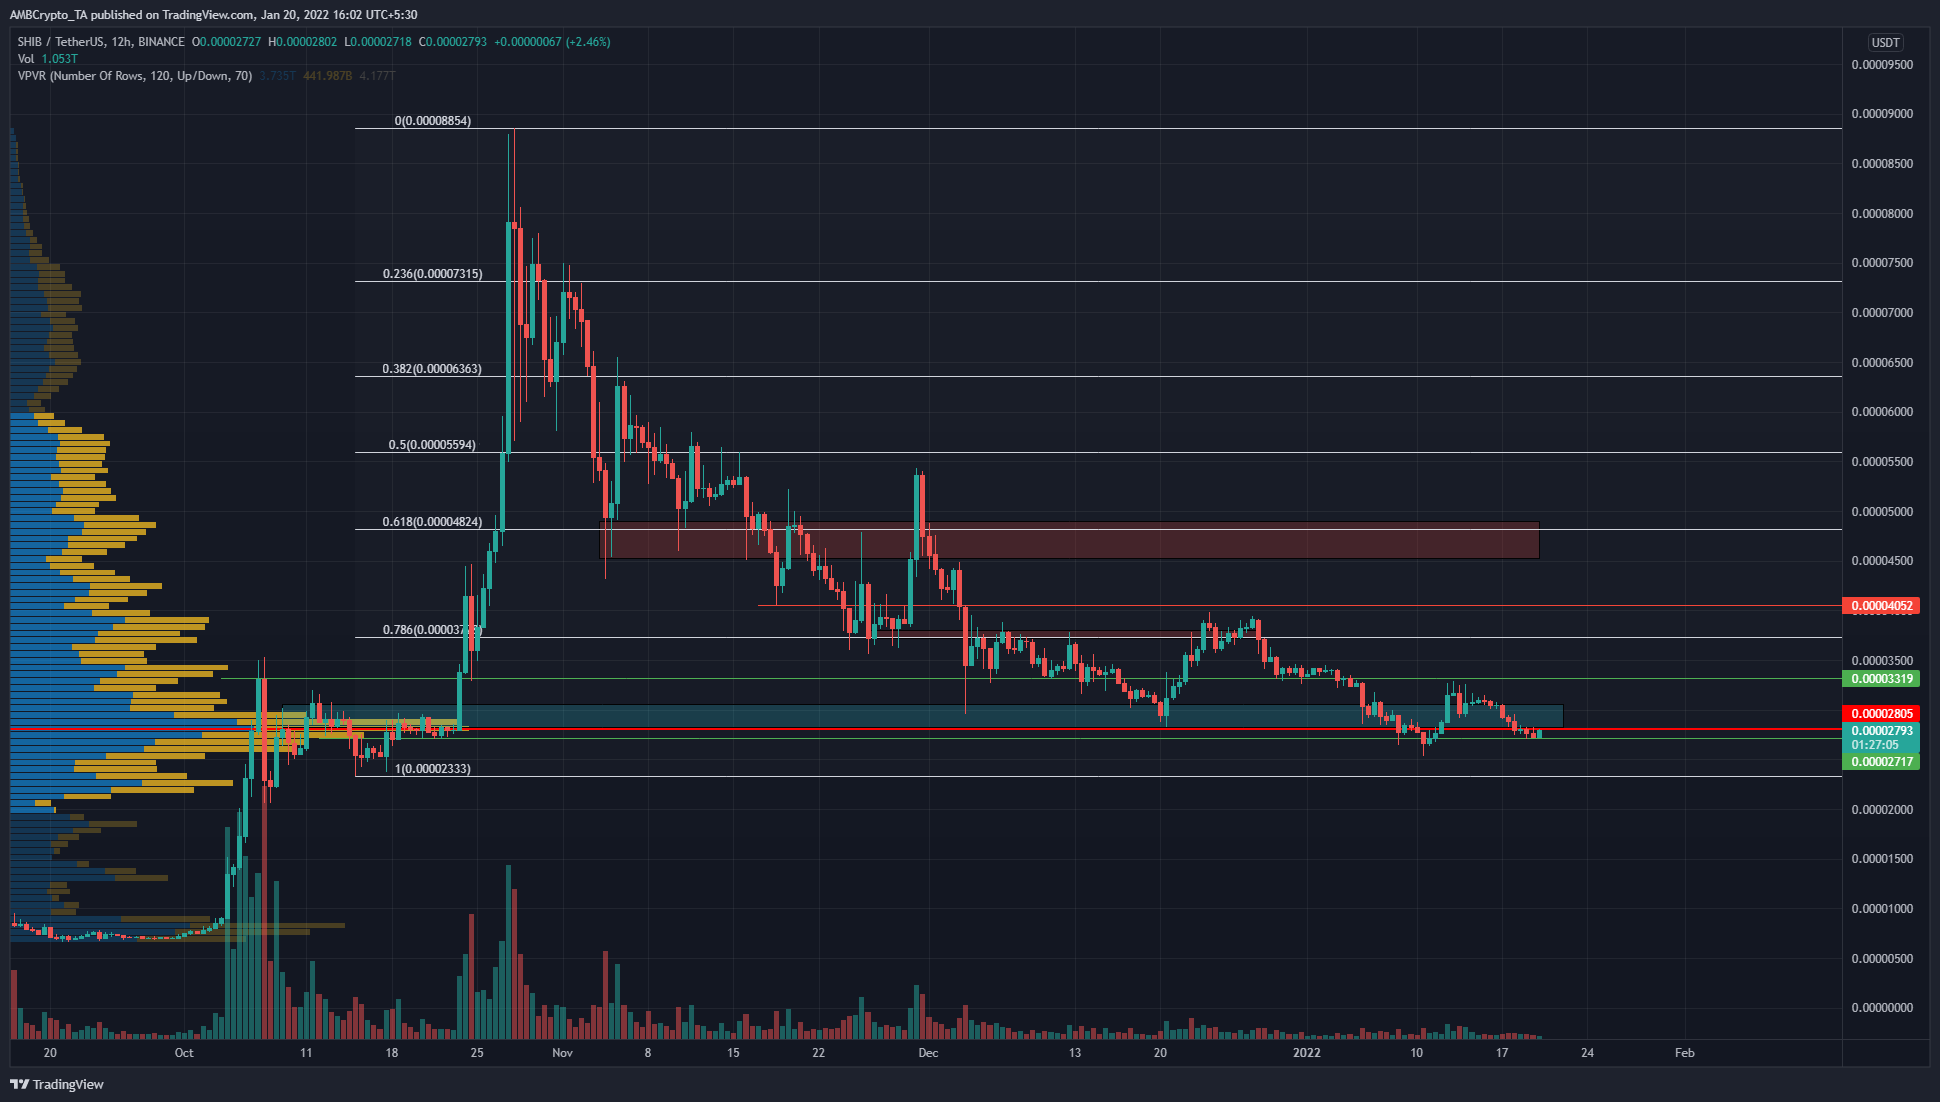
Since November, a strong bearish trend can be seen. Interspersed are brief, strong rallies that Shiba Inu has embarked on. Each one had hordes of traders and investors thinking, this is where the market turns. Unfortunately for the long-term buyers, it did not, and the price has reversed on each rally. At the same time, each bounce has also weakened.
Now, the price was trading at a crucial area of demand (cyan box) between $0.0282-$0.03. The Visible Range Volume Profile showed that the Point of Control (PoC) lay at $0.028, while a long-term support level can be found at $0.0271. This was quite close to the recent local lows SHIB set at $0.0266.
The price has oscillated about the demand area and the PoC. This represented the establishment of a range after a strong trend. SHIB could breakout in either direction from this point forth. Until such a time, the range lows and highs can be used as buying and selling opportunities.
Rationale

The Directional Movement Index showed a strong bearish trend as both the -DI (red) and the ADX (yellow) lines were well above 20. The MACD was below the zero line and formed a bearish crossover. The Aroon Oscillator showed that a bearish trend has been dominant, with a rally last week.
Conclusion
The consolidation phase can be followed by either a buying spree or another wave of selling. Until the highs or lows are flipped, the market direction would be undecided. Even if SHIB climbed past $0.03, it still had the $0.033 and $0.037 levels of resistance to the upside to flip. This development would be the beginning of a reversal in trend.