Shiba Inu finds support at this level and could head into an accumulation zone

Shiba Inu had a strong demand zone at $0.0297 (prices are multiplied by 1000 times the current prices to reduce decimal places). It dipped beneath this area to a support level but has seen some demand at that level. However, the price has not formed a higher high, nor has it formed equal lows. This meant that there was no evidence yet of the downtrend ending or stalling.
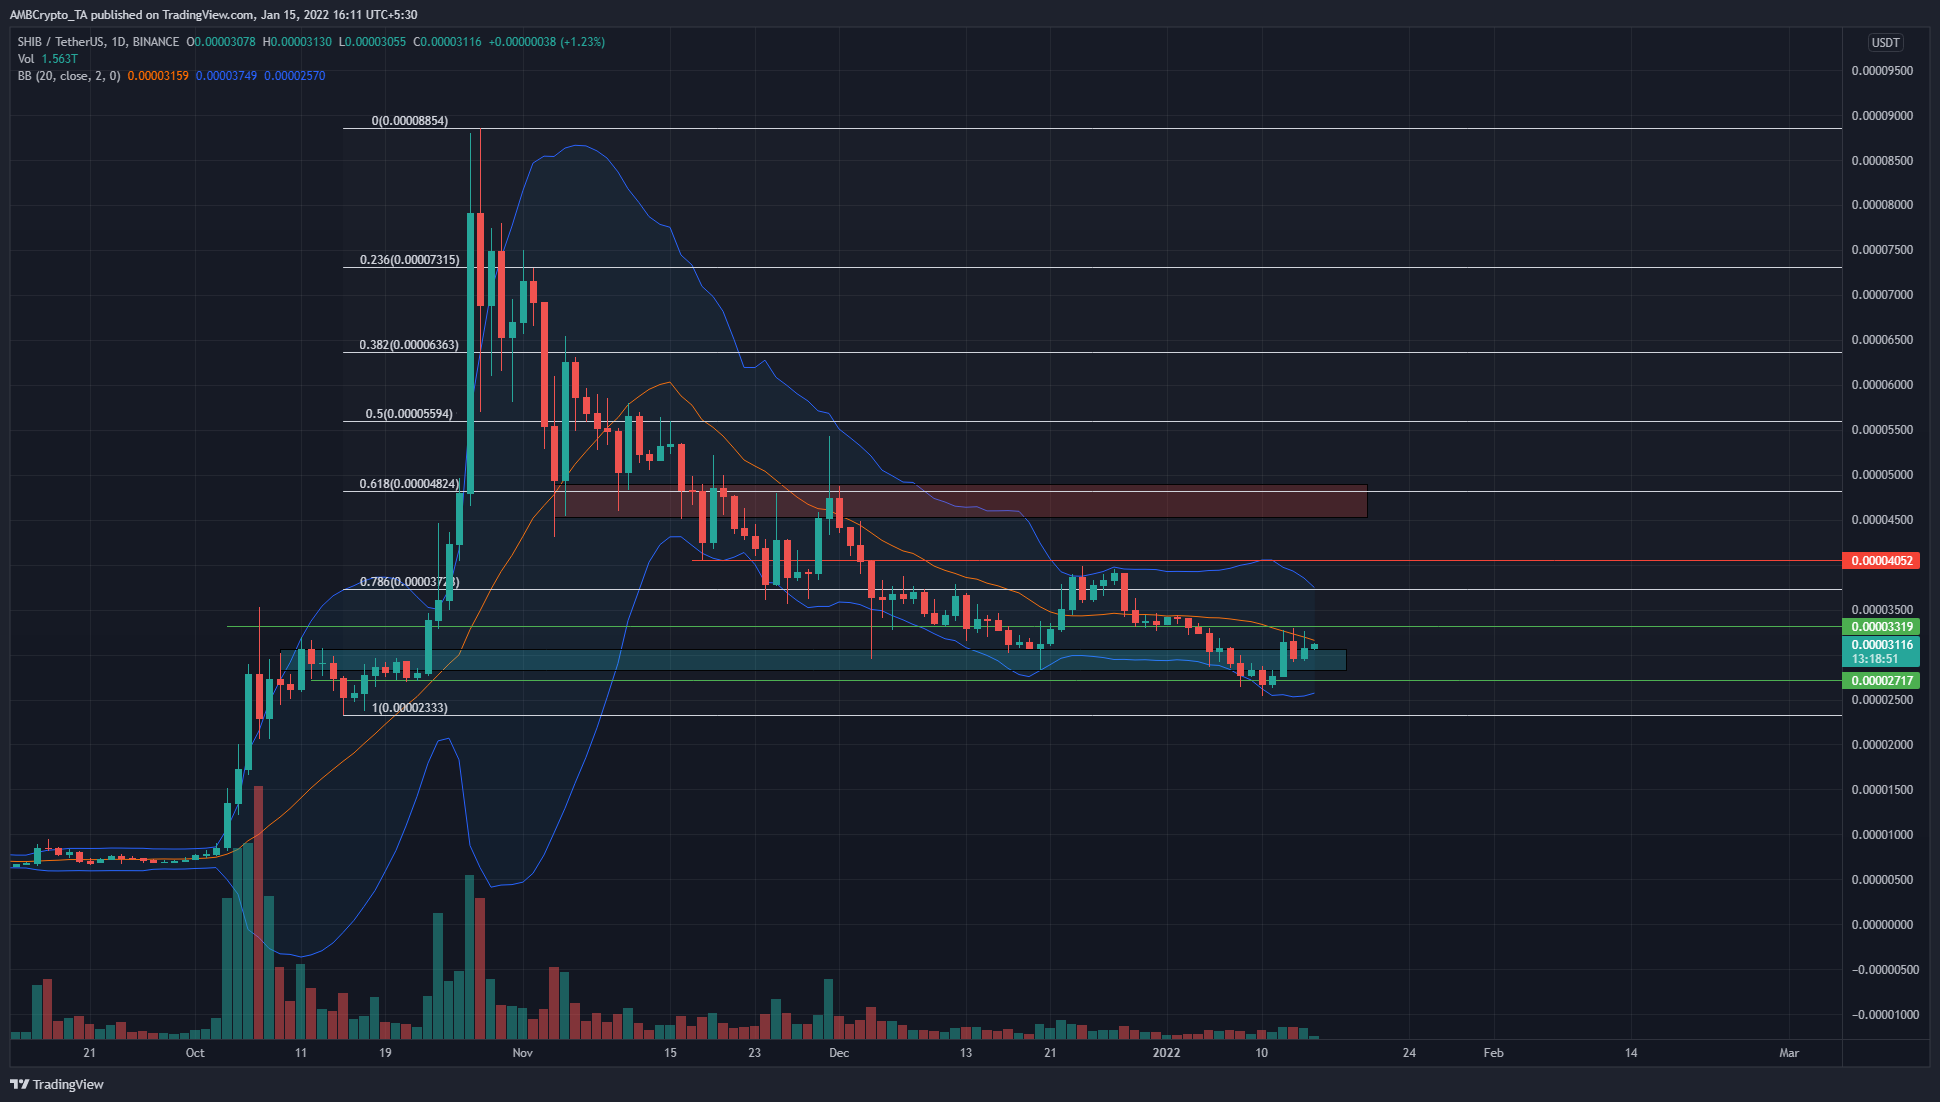
The Fibonacci retracement tool was used for SHIB’s move from $0.0233 to $0.0885. The 78.6% retracement level for this move lay at $0.0372. This level has been a level of resistance for SHIB since December, which was a bit discouraging for bulls.
However, the $0.027 area had been an area where the price stalled for a while before the strong bull run in mid-October. At the time of writing, the price had dipped slightly beneath this area before climbing back above.
The market structure was still bearish, as the previous highs on the daily chart have not yet been broken. Although the $0.027 area represents a good risk-to-reward area to buy SHIB at, the trend still remained bearish.
Rationale

The RSI has been moving below neutral 50 since mid-November, which signified a downtrend in progress for SHIB. At the time of writing, the RSI was at 47, meaning the bounce from the support level could be nearing its end, which would be confirmed if the RSI dropped in the next few days.
The 20-period SMA in the Bollinger Bands has also acted as resistance to the price recently.
The CMF was also headed below -0.05, which showed that capital flow was significantly headed out of the market.
Conclusion
Although the indicators showed bearish momentum, and the market structure was also bearish, the long-term demand area at $0.027 represented a good area to buy SHIB at. Swing lows beneath such areas of demand are sometimes seen before a trend reversal, and the next level of resistance to watch for lies at $0.0372 and $0.04, with the 20-day SMA acting as resistance as well.


