Shiba Inu: Here’s how SHIB buyers can leverage profitable buying opportunities

Disclaimer: The findings of the following analysis are the sole opinions of the writer and should not be considered investment advice.
- Shiba Inu witnessed a bullish rebound from its long-term support, can the buyers reclaim their edge?
- The Open Interest unveiled a slight near-term edge for the sellers.
After gliding toward its multi-monthly high on 14 august, Shiba Inu [SHIB] bears controlled the trend to their fancy for the last two months. As a result, the meme-coin saw a pulldown below its $0.0108-$0.0109 resistance range. (For brevity, SHIB prices are multiplied by 1000 from here on).
Here’s AMBCrypto’s Price Prediction for Shiba Inu [SHIB] for 2023-24
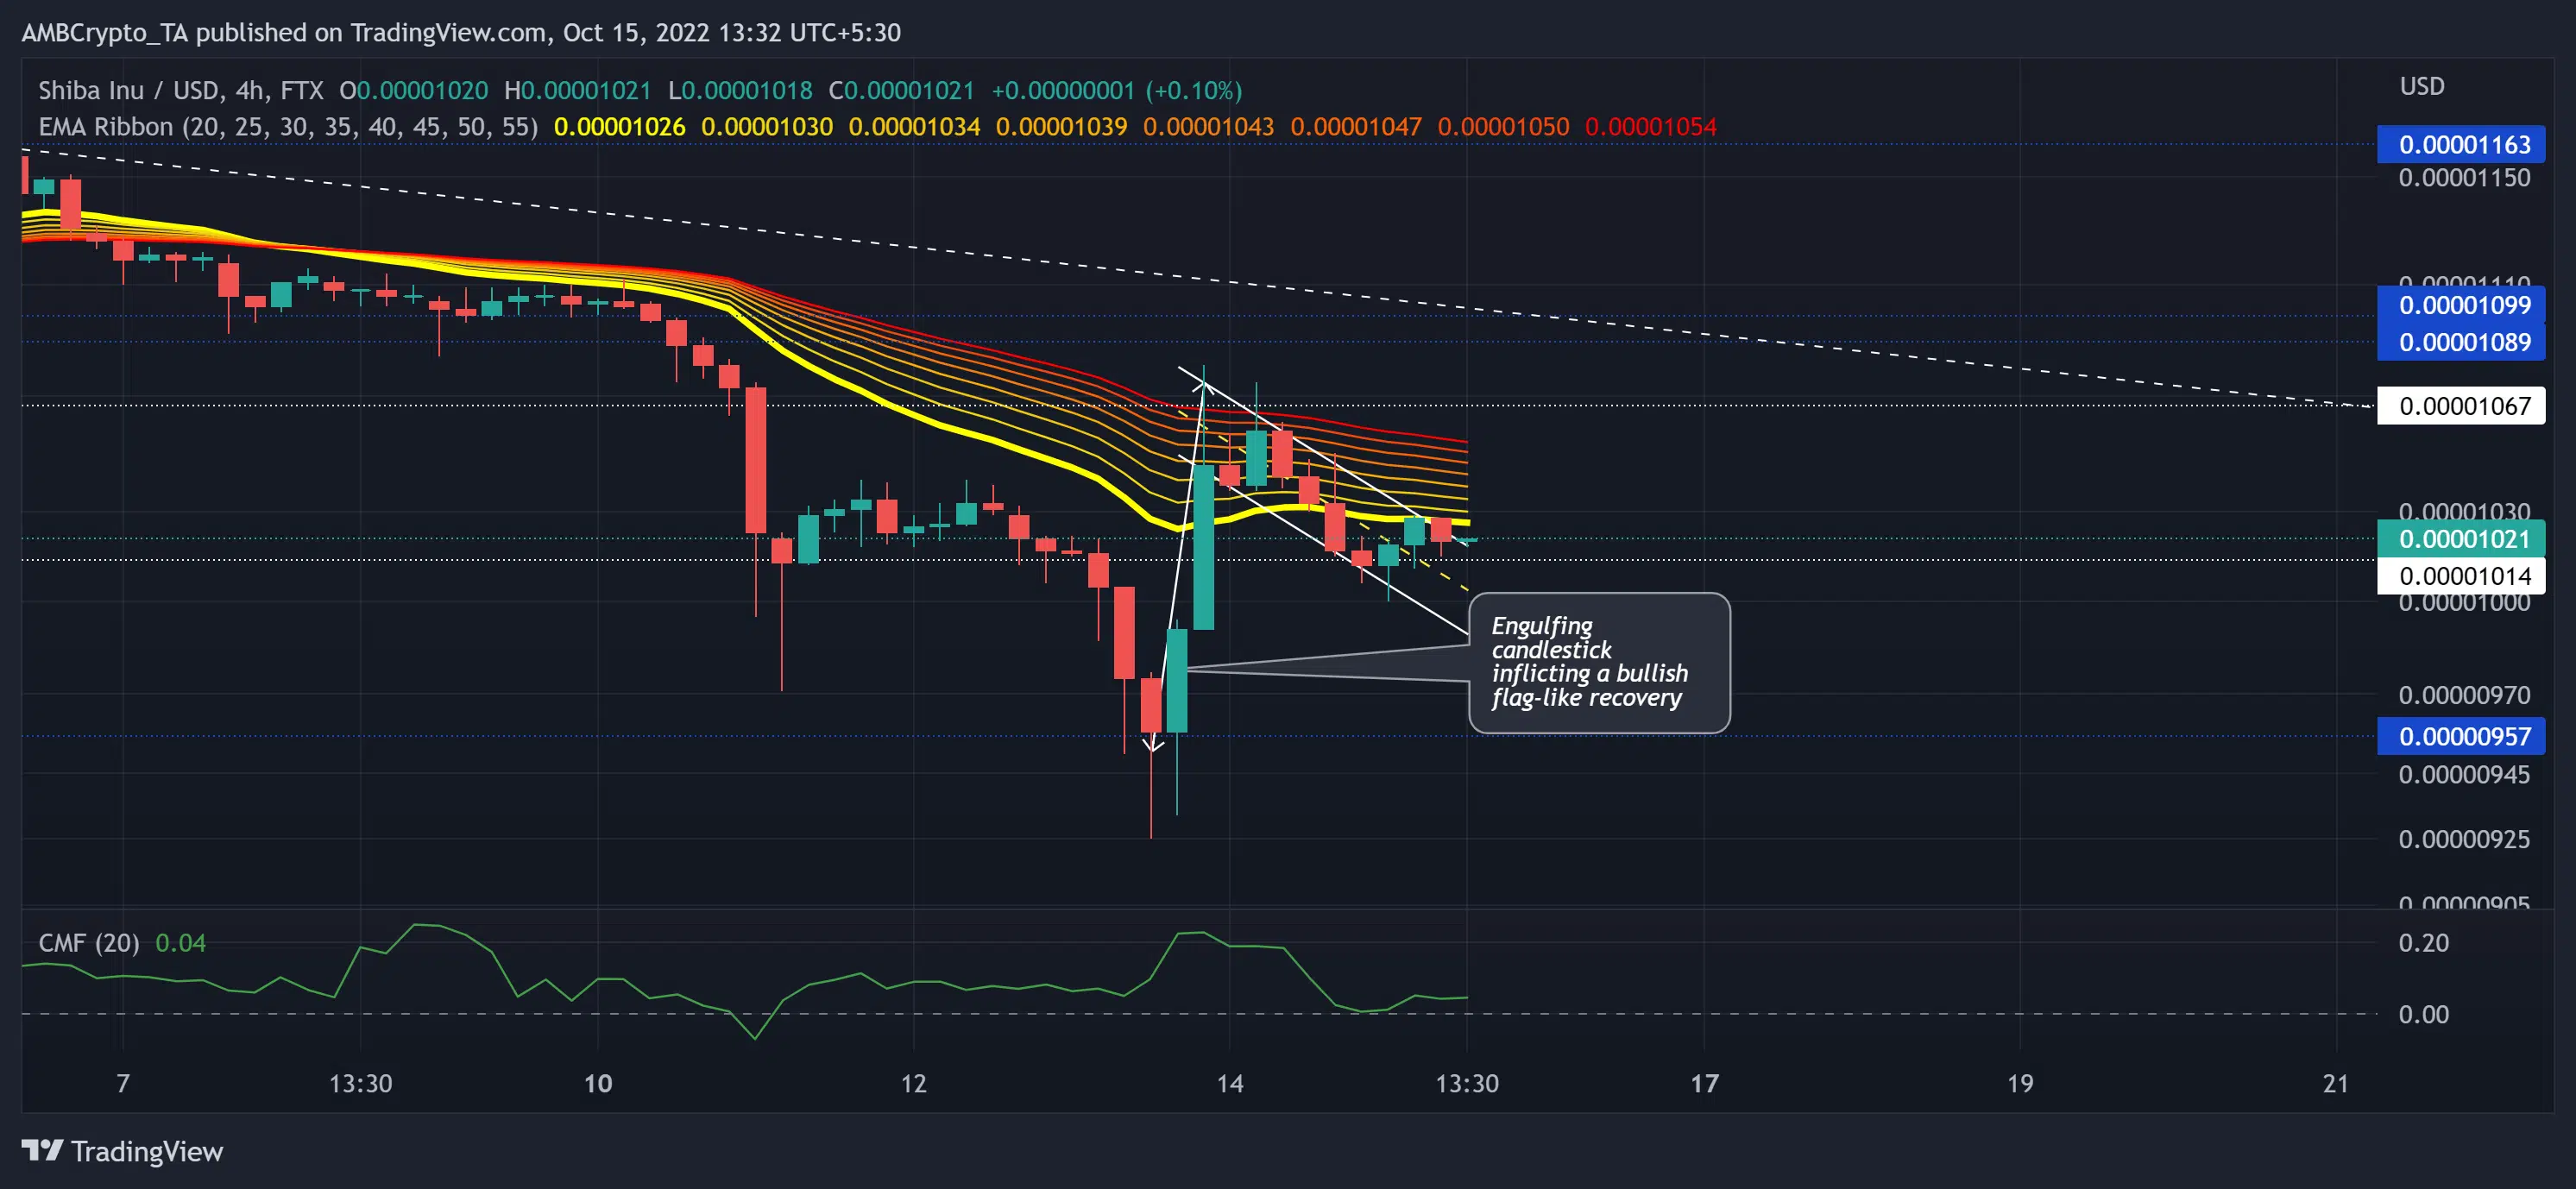
Recently, the $0.00957 support reignited some bullish pressure as the buyers strived to escape the constraints of the EMA ribbons. An immediate rebound from its immediate support could position the token to challenge the EMA resistance.
At press time, SHIB traded at $0.01021, down by 2.17%in the last 24 hours.
SHIB forms a bullish structure on H4, can the bulls sustain a rally?
Over the last week, SHIB’s descent from the two-month trendline resistance (white, dashed) set the stage for an expected pullback. Thus, the token fell below its EMA ribbons to depict a bearish advantage ever since.
While the EMA ribbons undertook a bearish flip, sellers capped the buying efforts near the 50 EMA over the last few days. The bullish engulfing candlestick inflicted a rally that entailed double-digit gains on 13 October.
A rebound from the $0.01014-level could propel near-term gains before a reversal. In this case, the coin would retest the $0.01067 resistance before committing itself to a trend.
An immediate or eventual close below the $0.01014-mark can expose the token toward a downside. In such circumstances, SHIB could witness a bullish invalidation and get into price discovery. An inability of the market players to inflict strong moves can encourage a rather compression phase in the $0.0104-$0.01067 range.
Furthermore, the Chaikin Money Flow’s (CMF) lower troughs over the last two days chalked out a bullish divergence with the price action. This reading reinforced a rebound possibility from the immediate support.
A decrease in price with an increase in Open Interest
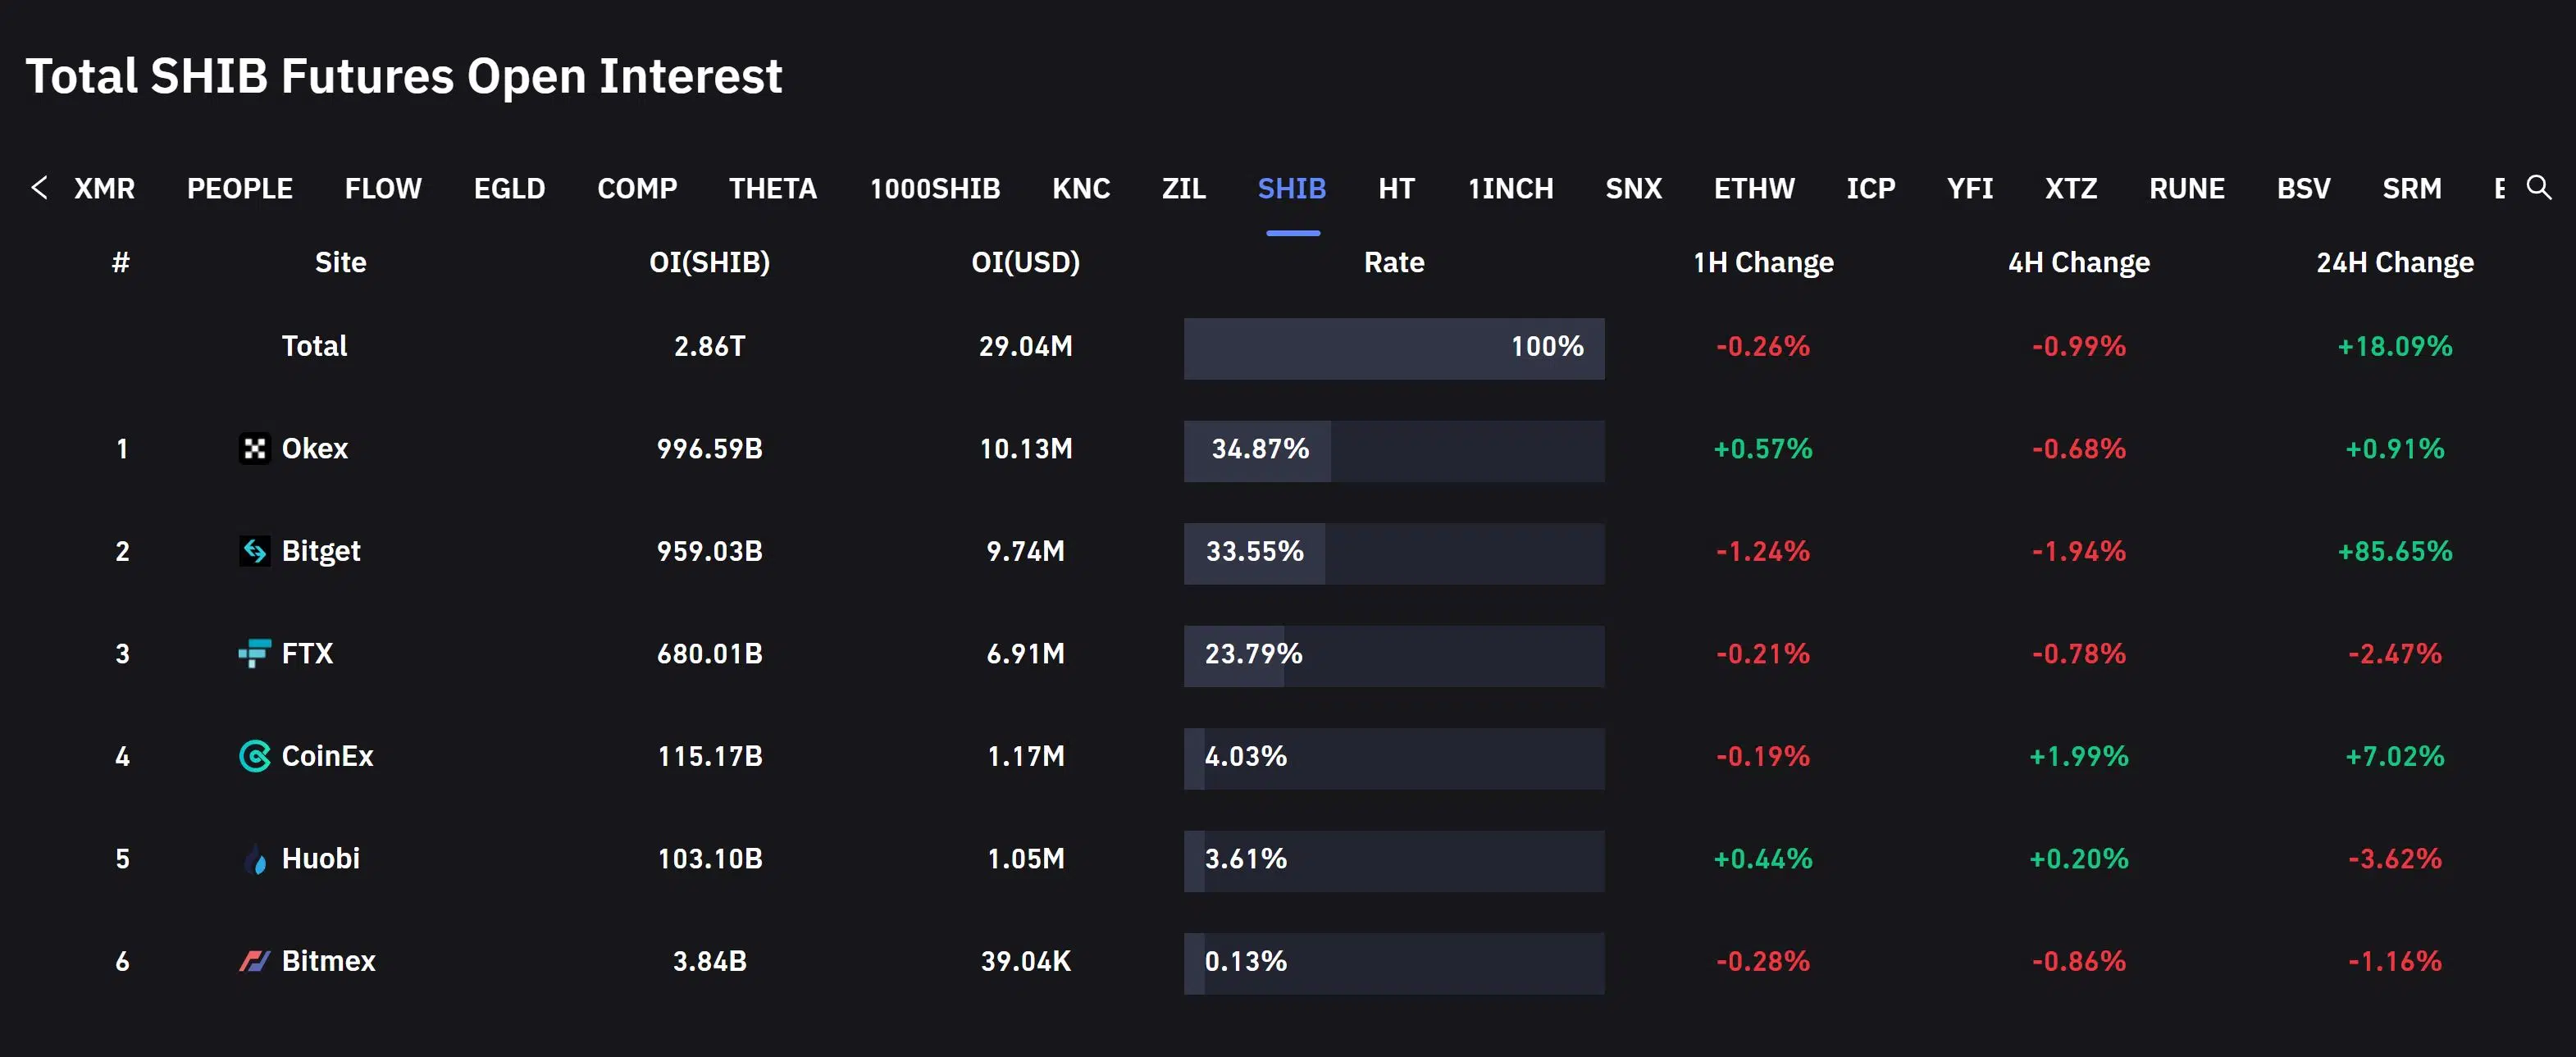
An analysis of SHIB Futures Open Interest revealed an over 18% jump over the last 24 hours. Correspondingly, the price action declined by over 2% in the past day.
Generally, a decline in price alongside an increase in Open Interest indicates that new short positions are being opened.
All in all, the buyers would look to reclaim their position above the EMA ribbon, especially with a bullish divergence on the CMF. But they must sustain a position above the current pattern to confirm the bullish bias. The targets would remain the same as discussed.
Also, the alt shares a 52% 30-day correlation with Bitcoin. Thus, keeping an eye on Bitcoin’s movement with the overall market sentiment could be essential to identify any bullish invalidations.


