Shiba Inu rallies 33% in a week, here is where bulls can look to re-enter

Disclaimer: The information presented does not constitute financial, investment, trading, or other types of advice and is solely the writer’s opinion
- The near-term market structure was in favor of the bulls
- Buyers can wait for a dip to an area of interest marked on the charts before looking to buy
Meme coin rallies sometimes mark the final days of a crypto market uptrend and a local top. This happened in late October when Shiba Inu [SHIB] climbed by nearly 55% to reach a swing high before falling rapidly by 23% on October 29 and 30. At that time, Bitcoin [BTC] was rejected at the $20.8k resistance and fell to $20.1k.
Is your portfolio green? Check the Shiba Inu Profit Calculator
This time, both BTC and SHIB have posted gains of close to 23.5% since 8 January, and Bitcoin reached the same level of resistance at $20.8k. SHIB has only kept pace with BTC thus far. If Bitcoin can consolidate for a few days, it could give time for money to trickle into altcoins, and Shiba Inu can embark on another large run upwards.
The former resistance zone is likely to get retested
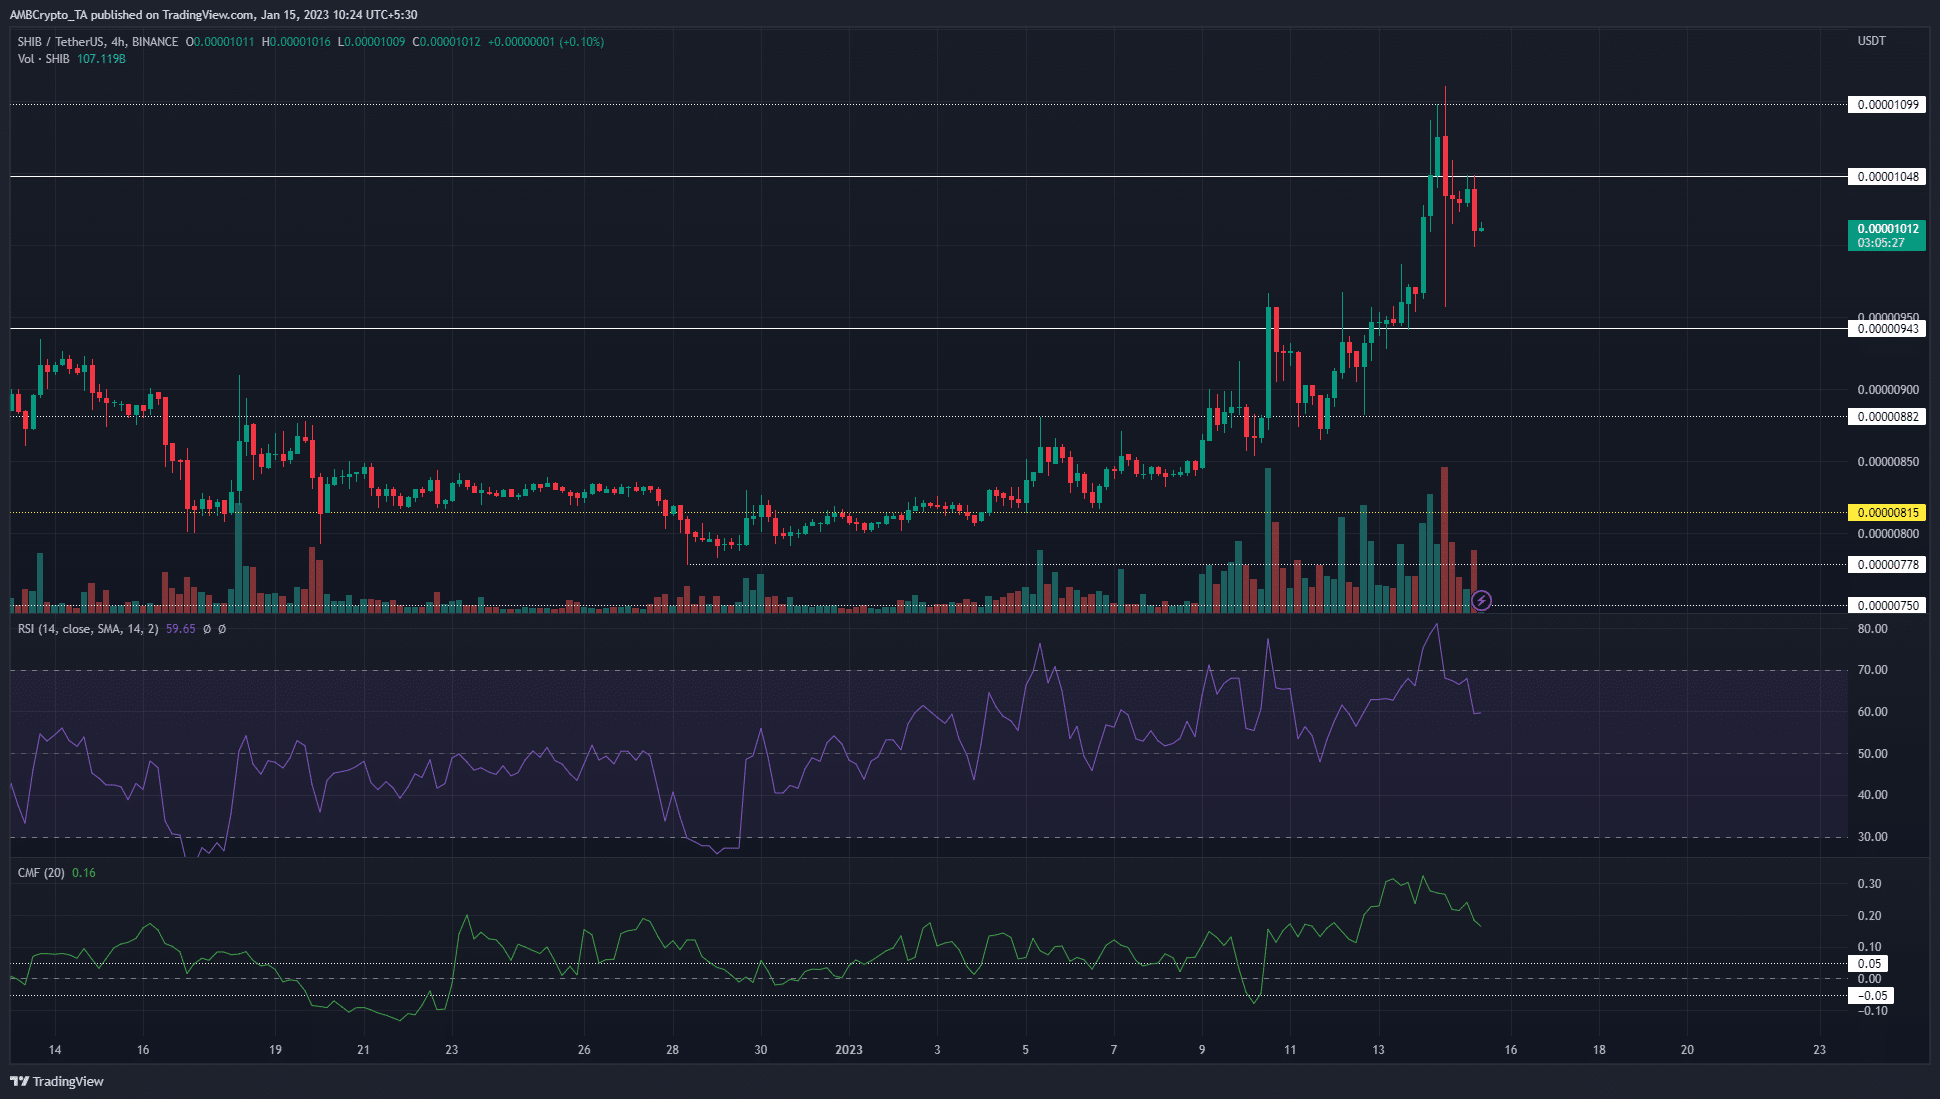
In the past two days of trading, Shiba Inu managed to push as high as the $0.000011 mark and receded since then. It saw a large southward candle wick on 14 January to dip to $0.00000957. Based on the price action, was likely that this wick would get filled, meaning SHIB would push that low once again.
Meanwhile, the technical indicators showed strong bullish pressure. The Chaikin Money Flow (CMF) was well above +0.05 to show significant capital flow into the market and the Relative Strength Index (RSI) stood close to 60 to signal considerable upward momentum.
The four-hour charts showed that the $0.0000095-$0.0000097 area has been an area of interest. The move above this zone on 5 December was reversed quickly which indicated that was a liquidity hunt. However, this time could be different.
How much are 100 SHIBs worth today?
For starters, there was the Bitcoin bullishness. BTC filled the inefficiency it left behind and retested a bearish order block at $21.2k, and a pullback to $19k-$19.5k was not unlikely. This could be accompanied by a SHIB drop to the area of interest at $0.0000095.
Such a dip would likely offer buying opportunities. Traders can look for signs of a reversal on lower timeframes to enter long positions.
Rising OI showed bullish intent, but some long positions were also knocked out in the recent dip
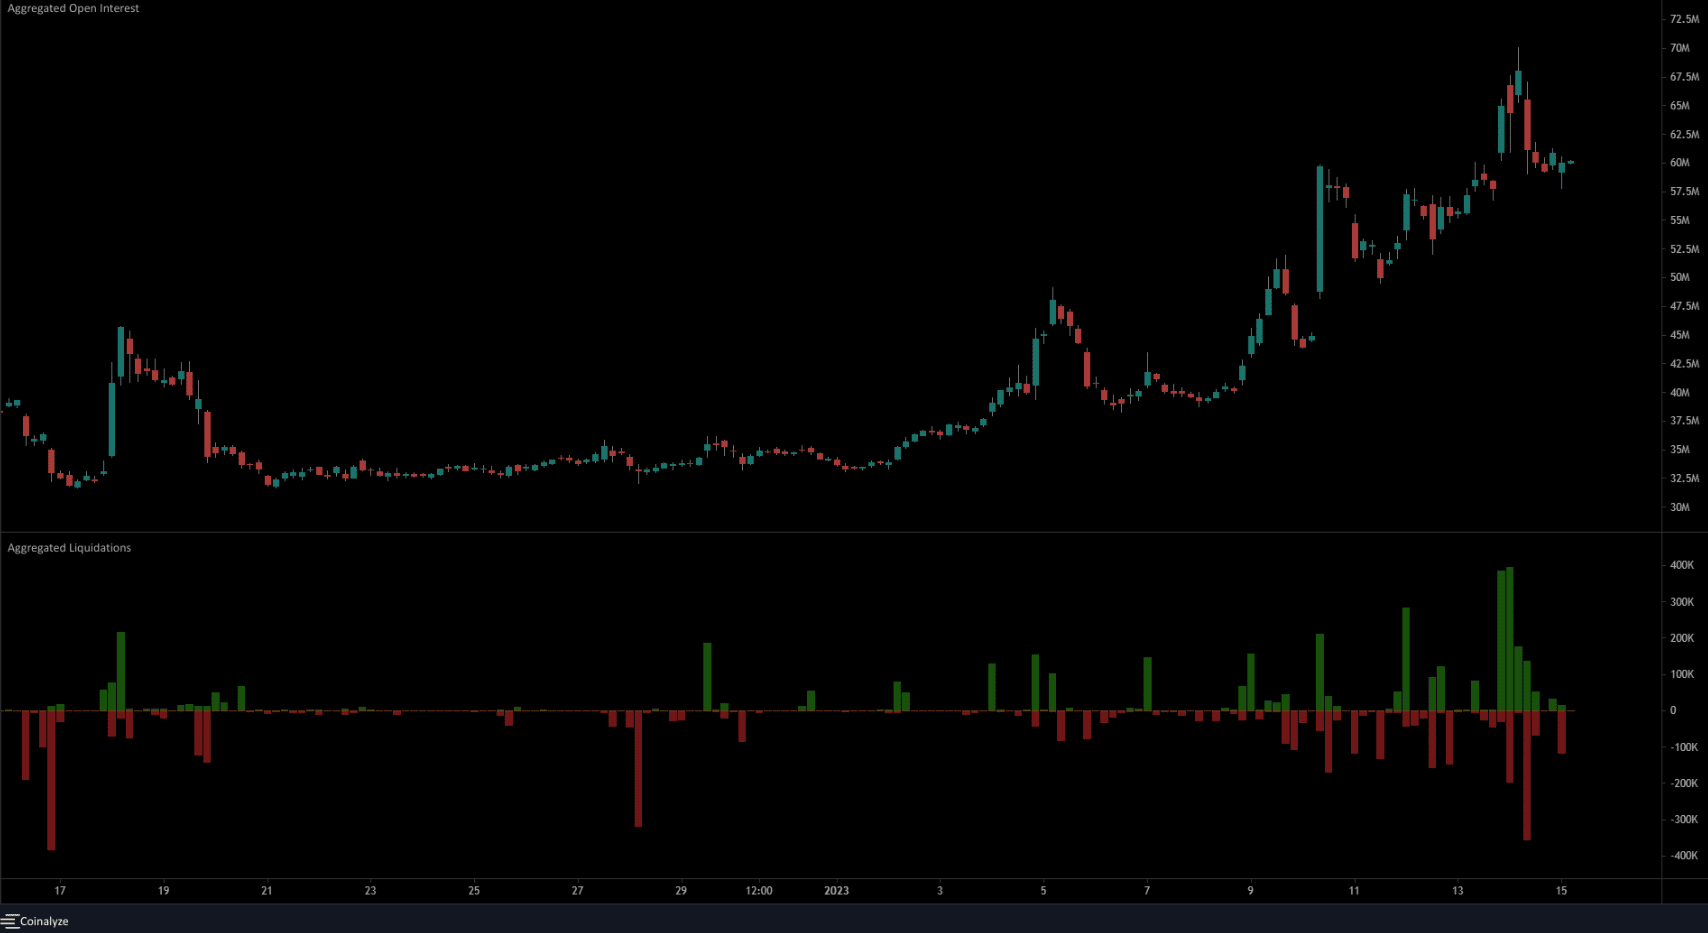
The market structure of SHIB remained bullish on the four-hour timeframe. It would take a SHIB drop beneath $0.00000915 to flip this bias. During the coin’s rally, OI also shot upward. This was a sign of money flowing into the market and highlighted strong bullish intent.
The move upward liquidated short positions as well, and in larger volume than any price movement since the drop on 9 November. This marked it as a significant move upward, and showed dips are for buying. A surge in long liquidations is something bulls can keep an eye on, as it could signal Shiba Inu was ready to climb higher once more.