Should Bitcoin traders really be concerned about a major market decline

Disclaimer: The findings of the following analysis are the sole opinions of the writer and should not be taken as investment advice
Bitcoin has had its ups its downs in 2021 so far. Q1 and Q2 began on a positive note as Bitcoin continued to climb to fresher records every month. On the other hand, Q3 was not so kind to the world’s largest digital asset. In May, BTC plummeted by over 50% and battled a bear market that lasted for over two months. Since then, however, Bitcoin has done well to recover.
A rally kickstarted in late July and price ceilings of $42k, $44k, and $48k were gradually overcome on the back of strong buying pressure. To stabilize this sporadic jump, a flash crash was seen on 7 September as BTC dropped by 19% from a value close to $53,000.
Now, some market observers are of the opinion that BTC is entering yet another bear market phase. In some ways, their opinion may be sort of justified too. For instance, the fear and greed index declined from a reading of 78 just last month to its press time value of 48.
However, it is important to note that this index did tick up over the past week. In fact, some of BTC’s metrics are also starting to flash positive signs. Ergo, it’s perhaps too early to call for a bearish scenario.
Bitcoin Daily Charts
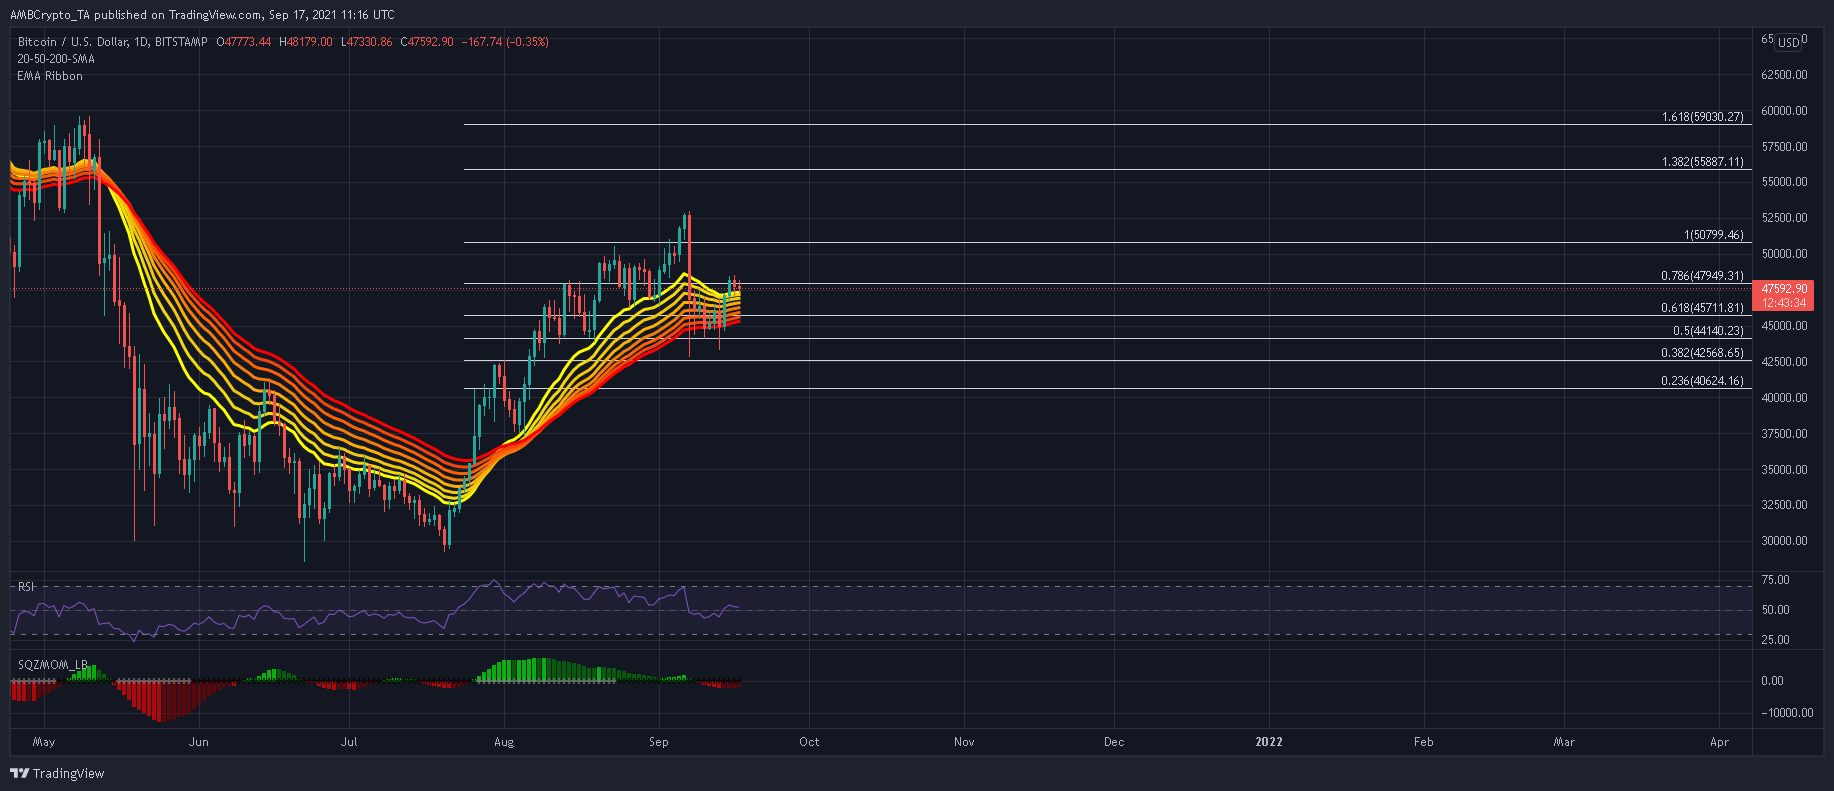
According to Bitcoin’s EMA Ribbons, the price is still within a bullish trend. Despite recent corrections, BTC managed to close within the boundaries of these moving average lines even though a few candlewicks noted strong sell sessions.
Moreover, the contracted nature of these bands suggested that a consolidation phase is in effect, as opposed to a bearish trend. In fact, the price is still above the 50% Fibonacci level, which is often considered a key area of bullish control.
If the price maintains its current ground, BTC would be on course to challenge the 138.2%, 161.8%, and 200% Fibonacci Extensions over the following months.
For a bearish argument, BTC needs to close below $42k – $40k. This would drag the price to lows seen in June and July.
Reasoning
A lot of fears stem from the fact that BTC’s RSI has been declining since late July, even though the price has been pushed higher. After all, this is a sign of a weakening trend. However, the RSI is not yet in bearish territory. The index bounced back from 45 and attempted to move back within its up-channel – A sign that bulls were resisting selling pressure.
Moreover, the Squeeze Momentum Indicator was making its way back towards the half-line – An indication that sellers are running out of steam. A green bar followed by white would even offer buy signals for bullish traders.
Conclusion
While there are reasons to fear an extended market decline, such arguments are not warranted just yet. BTC is trading above important areas and its metrics have been improving.
If BTC holds its ground, the price will be on course to tackle the 138.2%, 161.8%, and 200% Fibonacci Extensions in the coming months.


