
The market sprung from its immediate lows after the near-term technicals on the 4-hour timeframe of many alts entered the oversold mark. As a result, Solana and EOS saw breaks from their reversal patterns.
Also, ApeCoin got enough thurst to test the $19.6-mark while continuing its rising wedge momentum. Now, the bulls needed strong volumes to prevent an incoming bearish counter.
Solana (SOL)

Source: TradingView, SOL/USD
SOL saw a nearly 16.37% retracement between 20-25 April while descending in a down-channel (yellow) on its 4-hour chart. The rising wedge setup preceded this decline while the sellers halted the buying spree at the $109.4-mark.
Furthermore, the three-week trendline resistance (white, dashed) put additional pressure on buyers before they dwindled and the price fell below the Point of Control (red). Now, the recent down-channel breakout could see some resistance in the $102-zone before a trend commital move.
At press time, SOL was trading at $101.175. The alt’s RSI geared up from the oversold region and saw a nearly 22-point surge in the last 24 hours. Thus, finding a position above the midline whilst favoring the bulls. But a price reversal from the POC could affirm a bearish divergence with the index.
ApeCoin (APE)
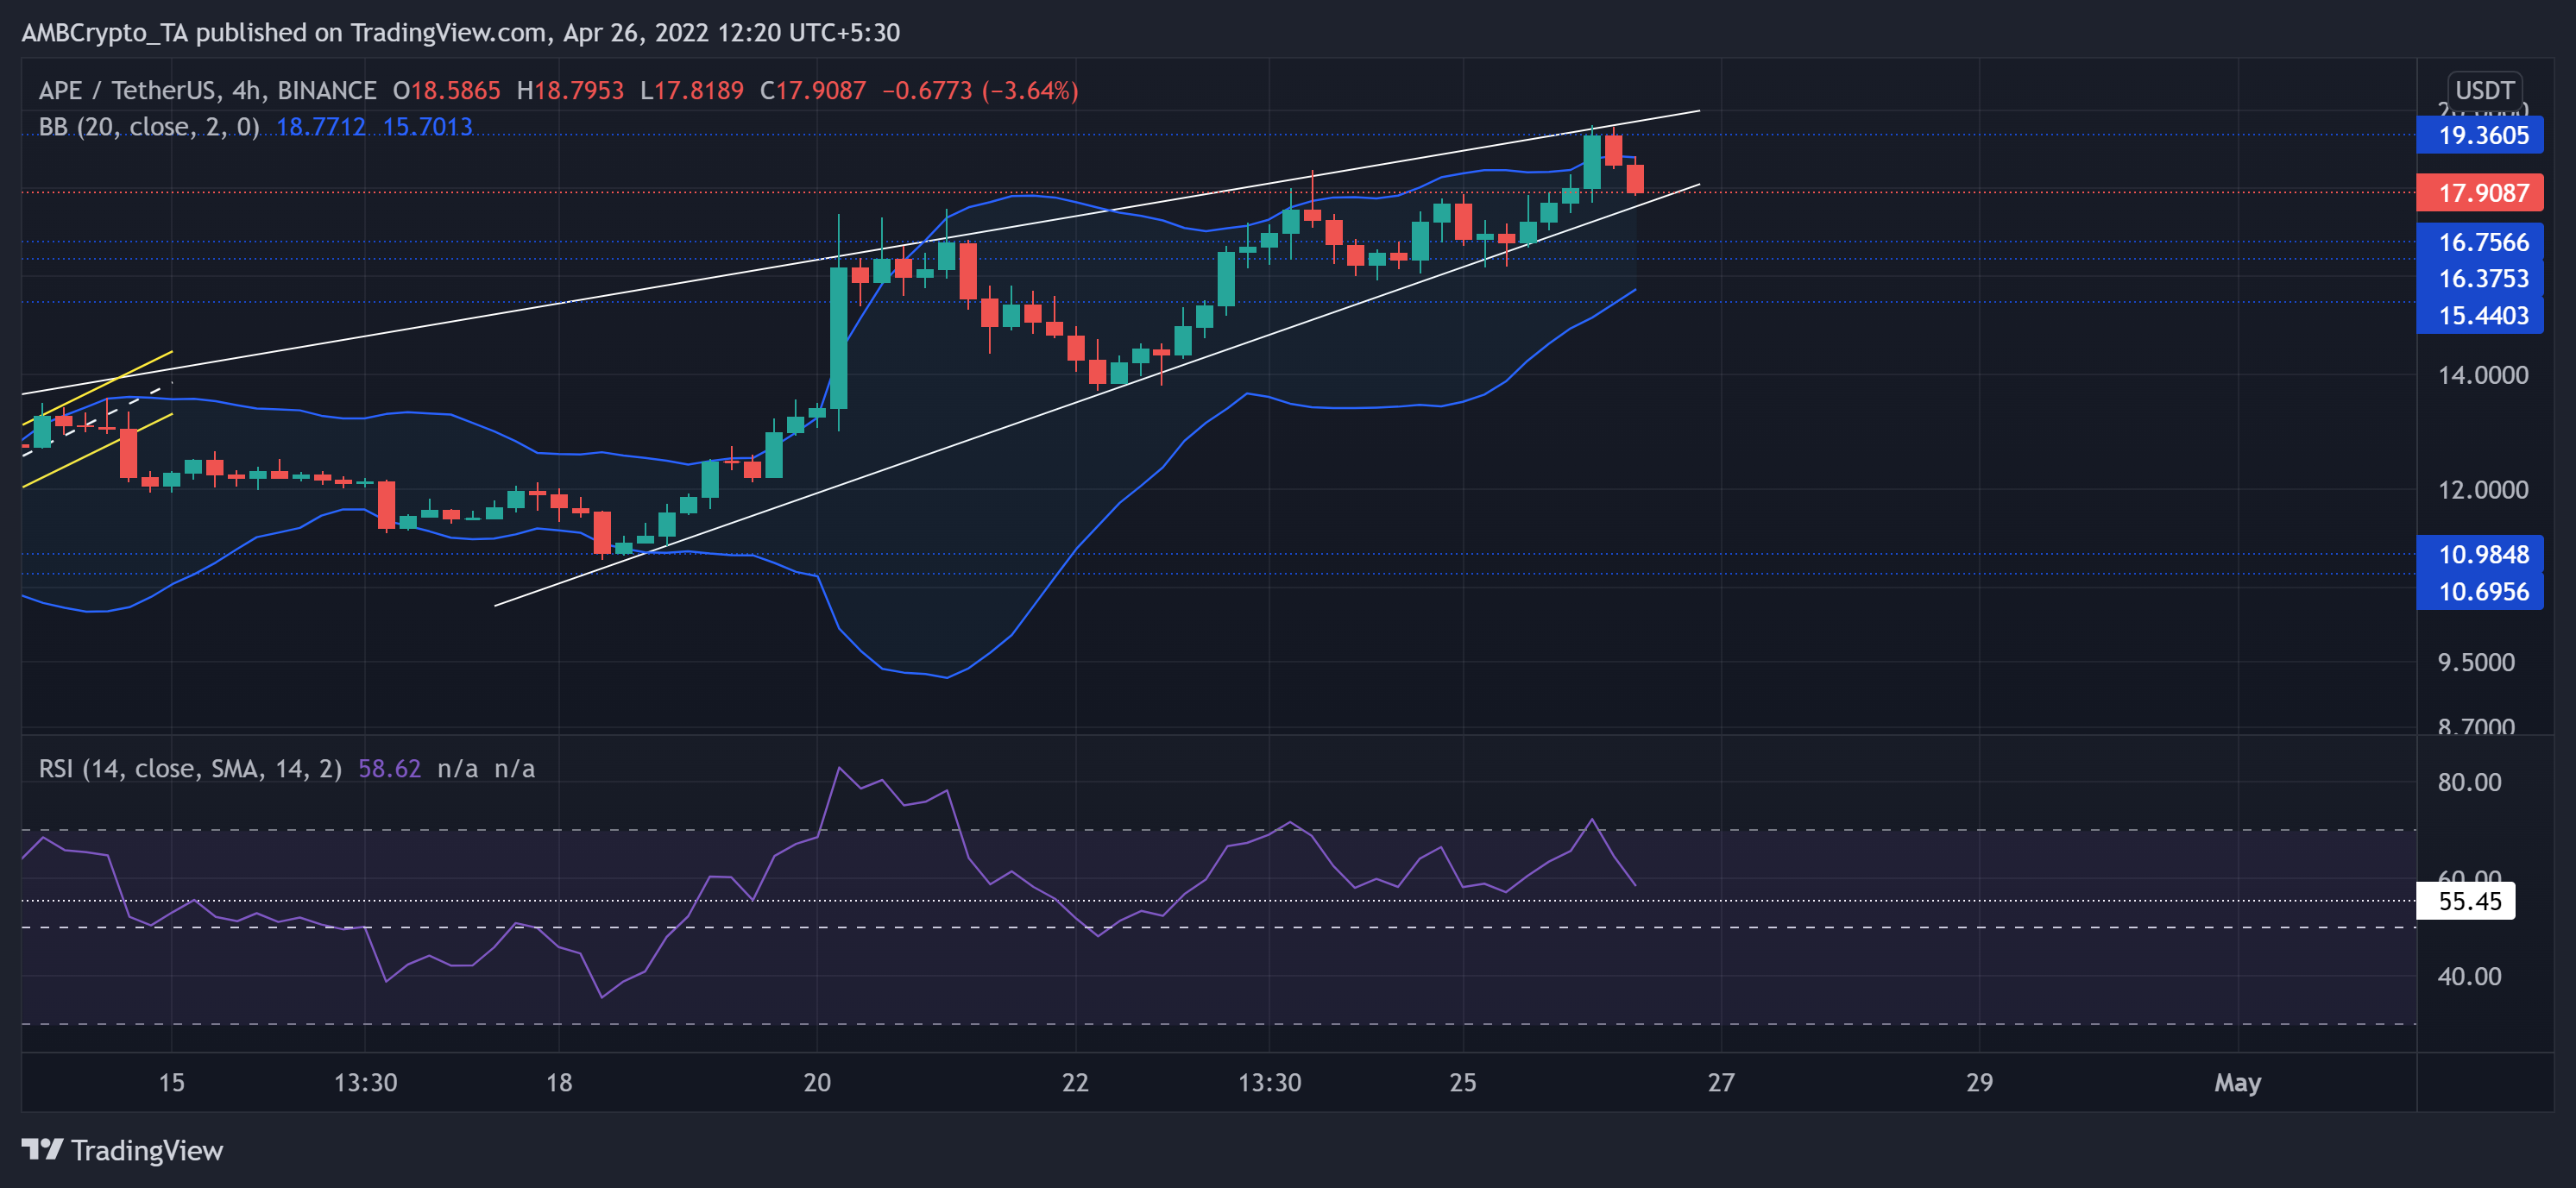
Source: TradingView, APE/USDT
Since rebounding from the $10.98-floor, APE bulls have been on a quest to mark fresher highs while redefining the oscillation bounds for the alt. This bullish resurgence rode along the confines of a rising wedge on the 4-hour timeframe.
After an exceptional 77.86% ROI from the $11 lows, APE peaked towards its five-week-high near $19.6 in just the last week. With no surprise, the price approached the upper band on the Bollinger Bands (BB). While buying pressure slightly eases, APE could test its immediate support at the lower trendline of the wedge.
At press time, APE traded at $17.9087. The Relative Strength Index downgraded after an expected reversal from the overbought mark. An extended decline from here could continue to find support near the 50-55 range.
EOS
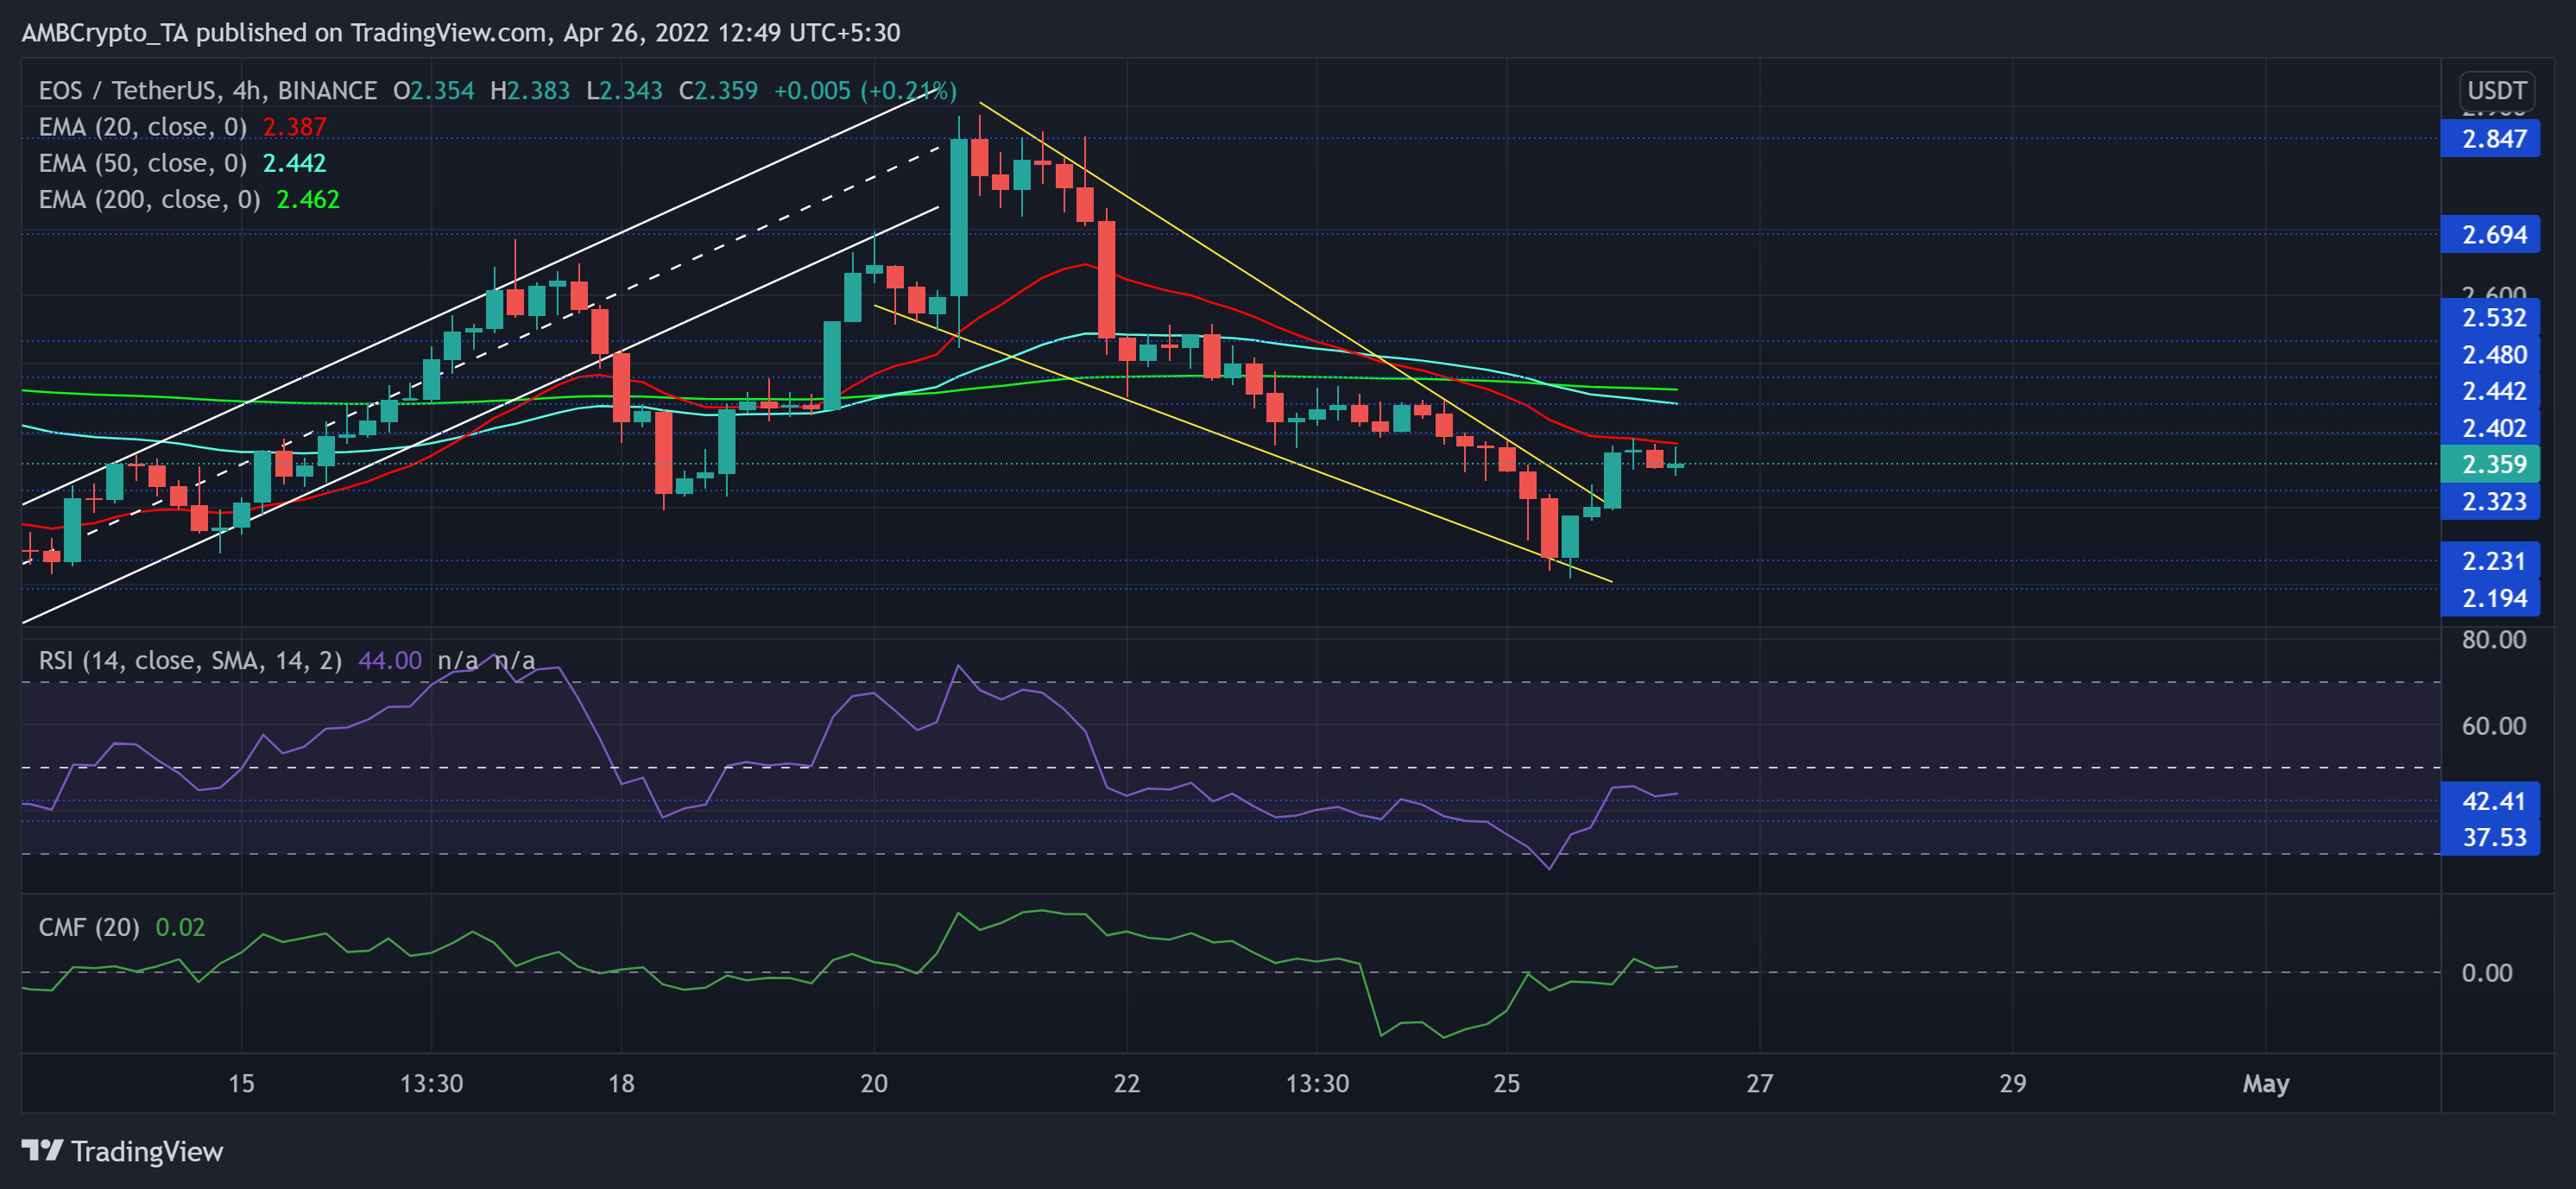
Source: TradingView, EOS/USDT
EOS saw a falling wedge (yellow) decline of about 23% until the bulls displayed strong rejection of lower prices at the $2.2-mark. This fall was triggered after the sellers continued to build up pressure at the $2.8-mark.
Now, the buyers would aim to reclaim the $2.4-mark while the bears continue to pose obstruction at the 20 EMA (red). With the 20EMA still below the 50/200 EMA, the sellers visibly had a near-term edge.
At press time, EOS traded at $2.359. The slightly bearish RSI failed to break above its equilibrium, while the 42-support seemed to hold near-term pullbacks. However, with the CMF jumping above the zero-mark, buyers would likely not dwindle at the immediate price support.