Solana, Chainlink, Cosmos Price Analysis: 28 April

Bitcoin’s bounce from $38k has spurred many altcoins to see near-term bullish pressure as well. Chainlink was one such coin, while Solana also showed the possibility of a bounce. Cosmos faced strong resistance at $102.
Solana (SOL)
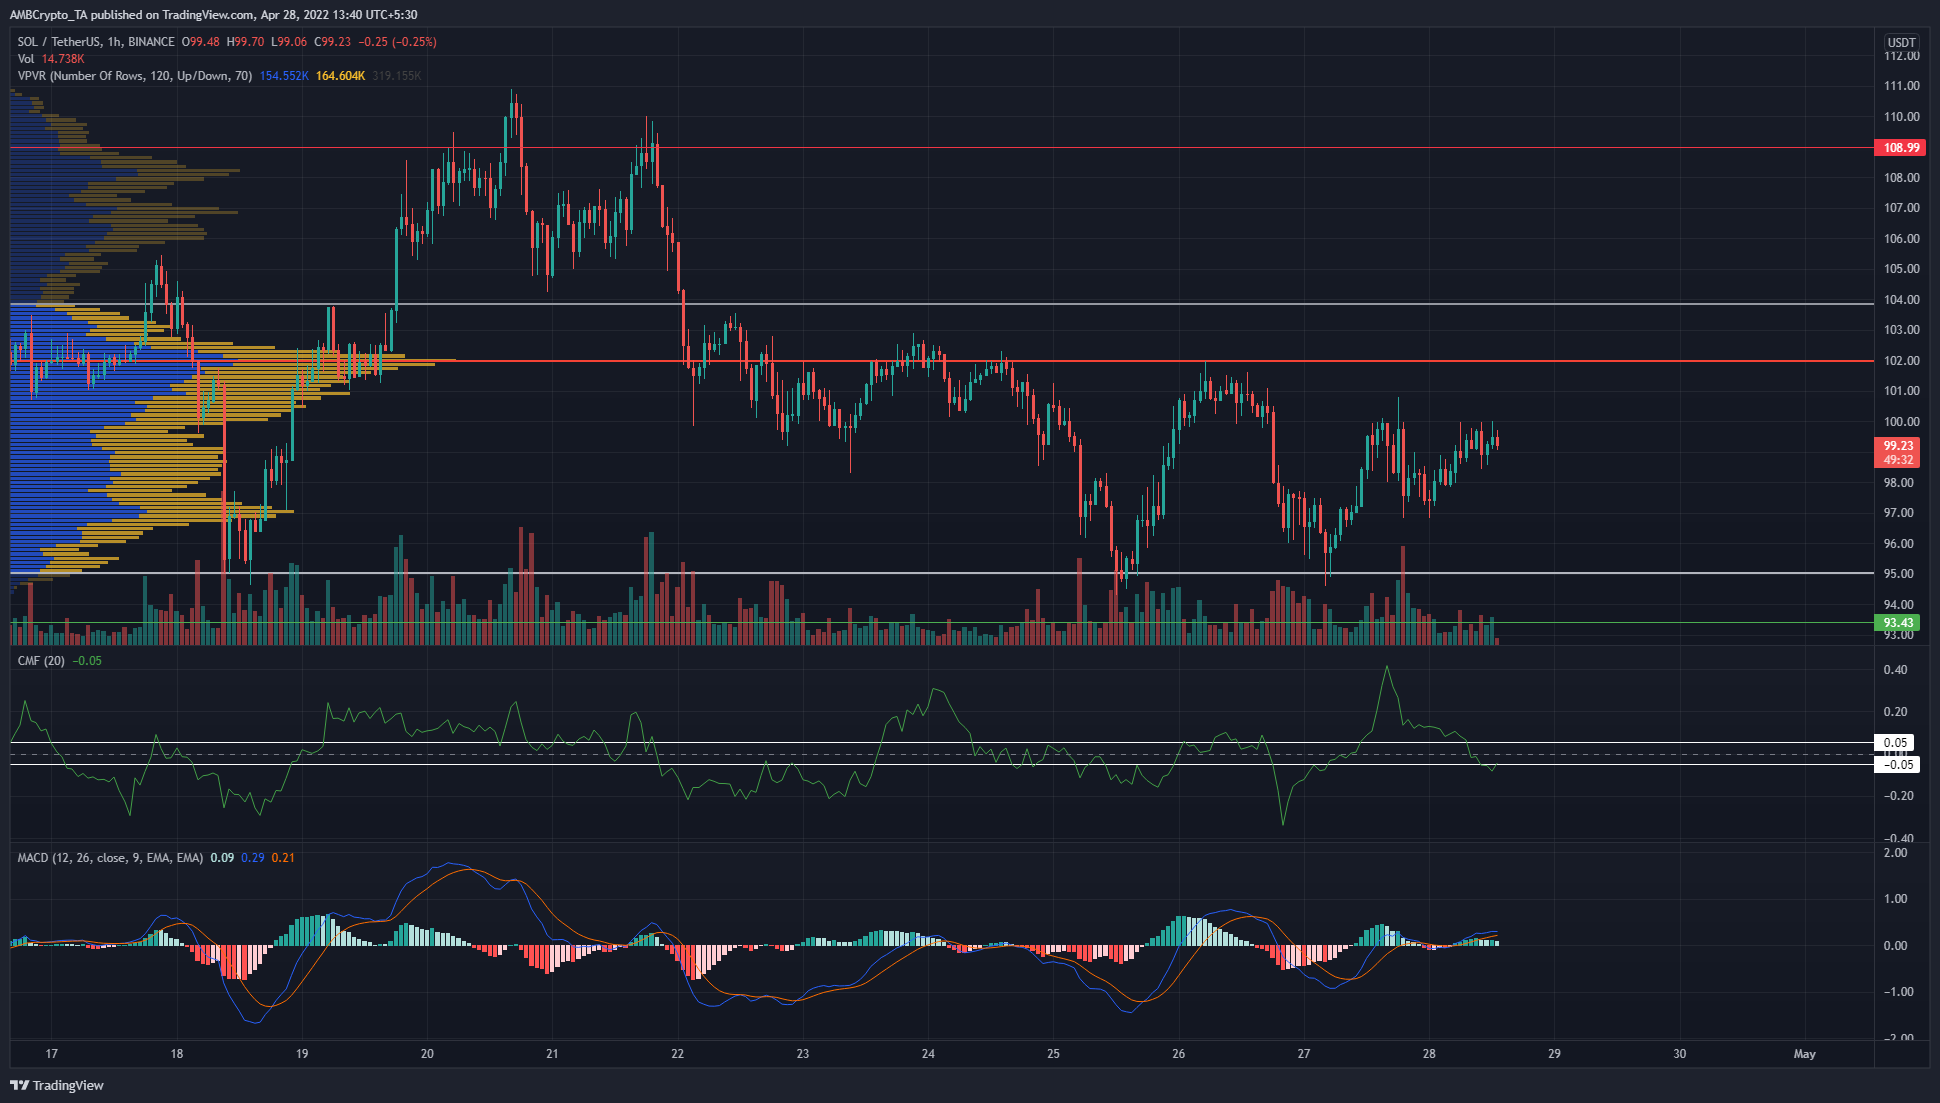
The Volume Profile Visible Range tool showed the Point of Control for SOL to lie at $102, based on the past ten days’ worth of trading. Within this time period, SOL was unable to break past the $109 resistance level but was also unable to break the $95 support level.
In the past few days, the market structure has been bearish. The price slipped beneath the POC and, at the time of writing, the bulls and bears were fighting for control of the $100 level. The CMF indicators showed strong selling pressure over the previous day and looked to be on the verge of slipping beneath the -0.05 mark to show heavy selling.
The MACD, on the other hand, was above the zero line to show bullish momentum and gave a buy signal. However, the overall trend on the lower timeframe remains bearish as $102 remains a resistance zone.
Chainlink (LINK)
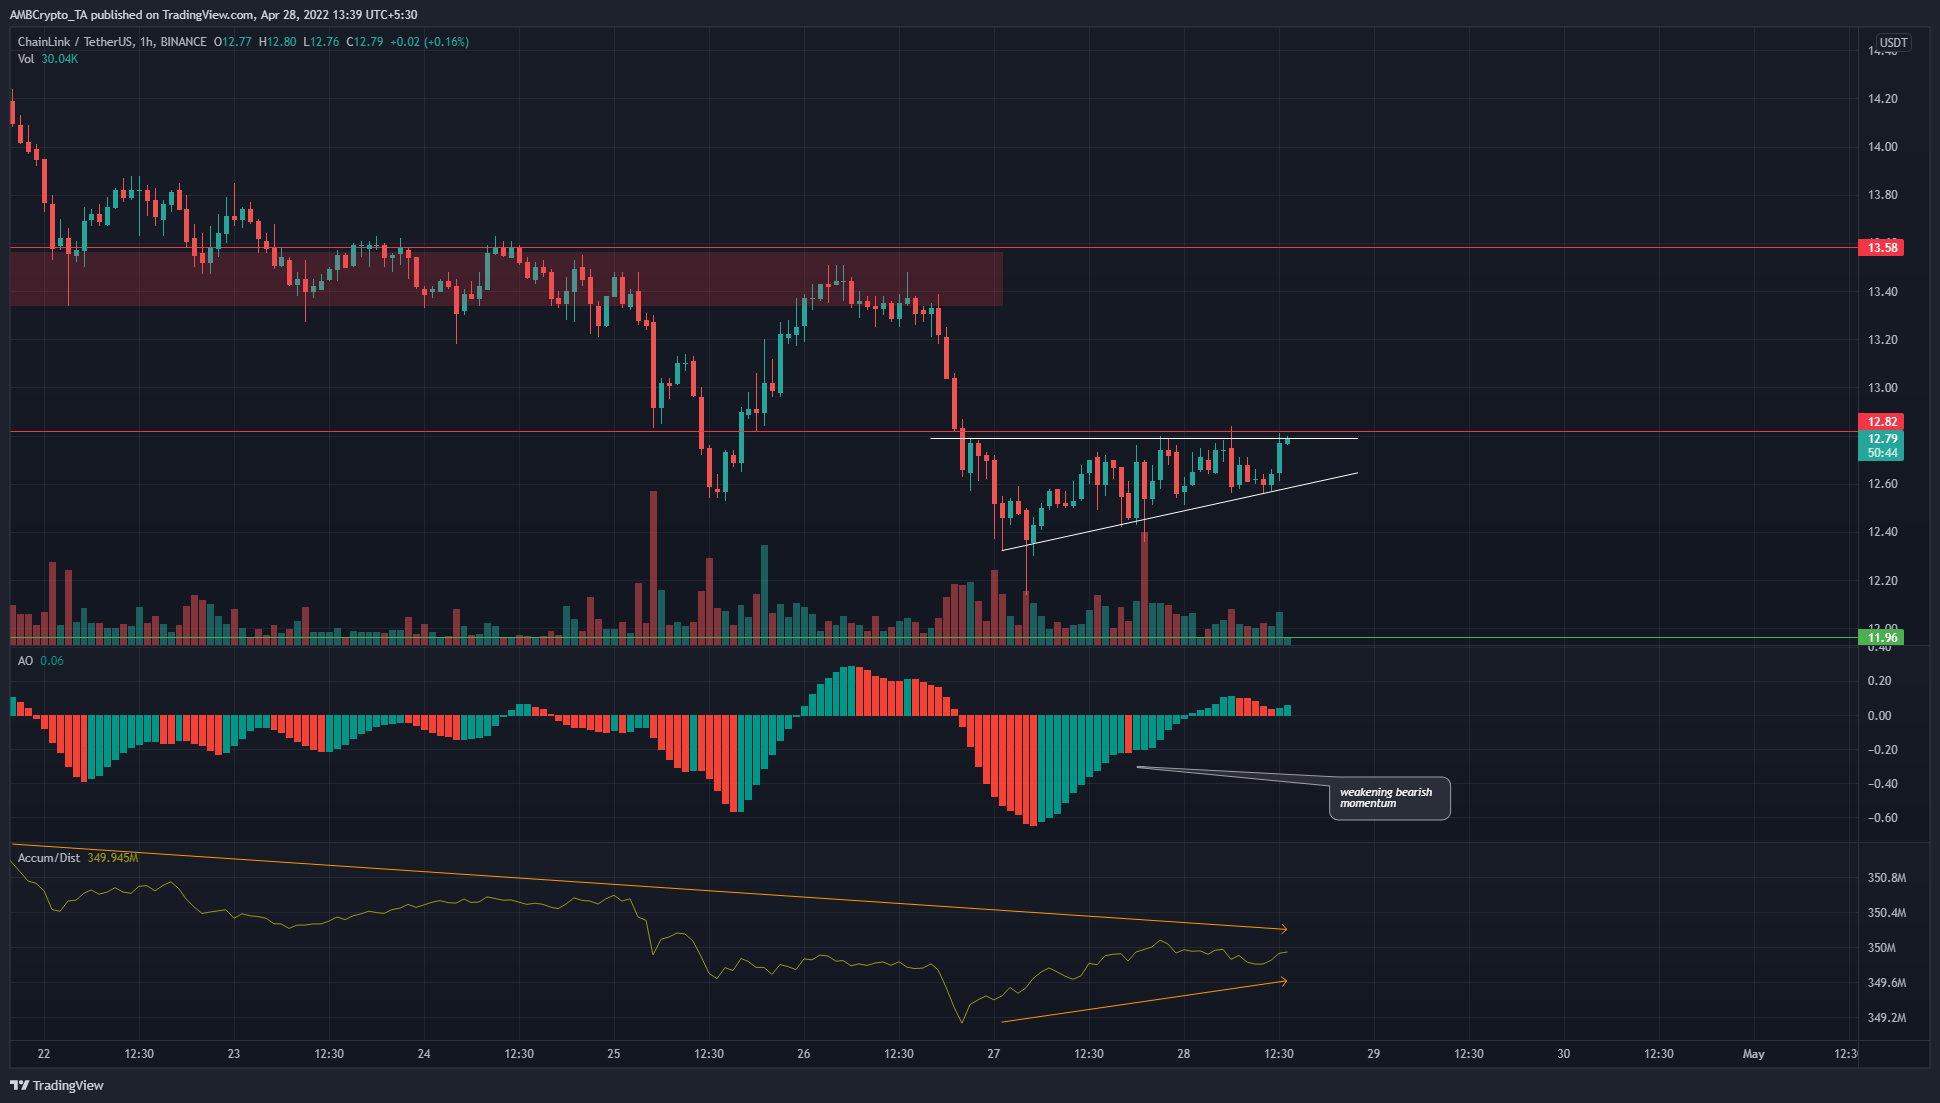
Chainlink formed an ascending triangle pattern (white) over the past couple of days after a pronounced downtrend in the past week. This pattern generally sees a breakout upwards.
In support of this, the Awesome Oscillator climbed back above the zero line to show bullish momentum. The A/R line also saw a bounce to show the presence of demand and buying volume.
However, the market structure on higher timeframes remained bearish. Rather than buying a breakout, selling a retest of the $13 level or the $13.4 supply zone would be the more advantageous trade as it goes with the larger trend.
Cosmos (ATOM)
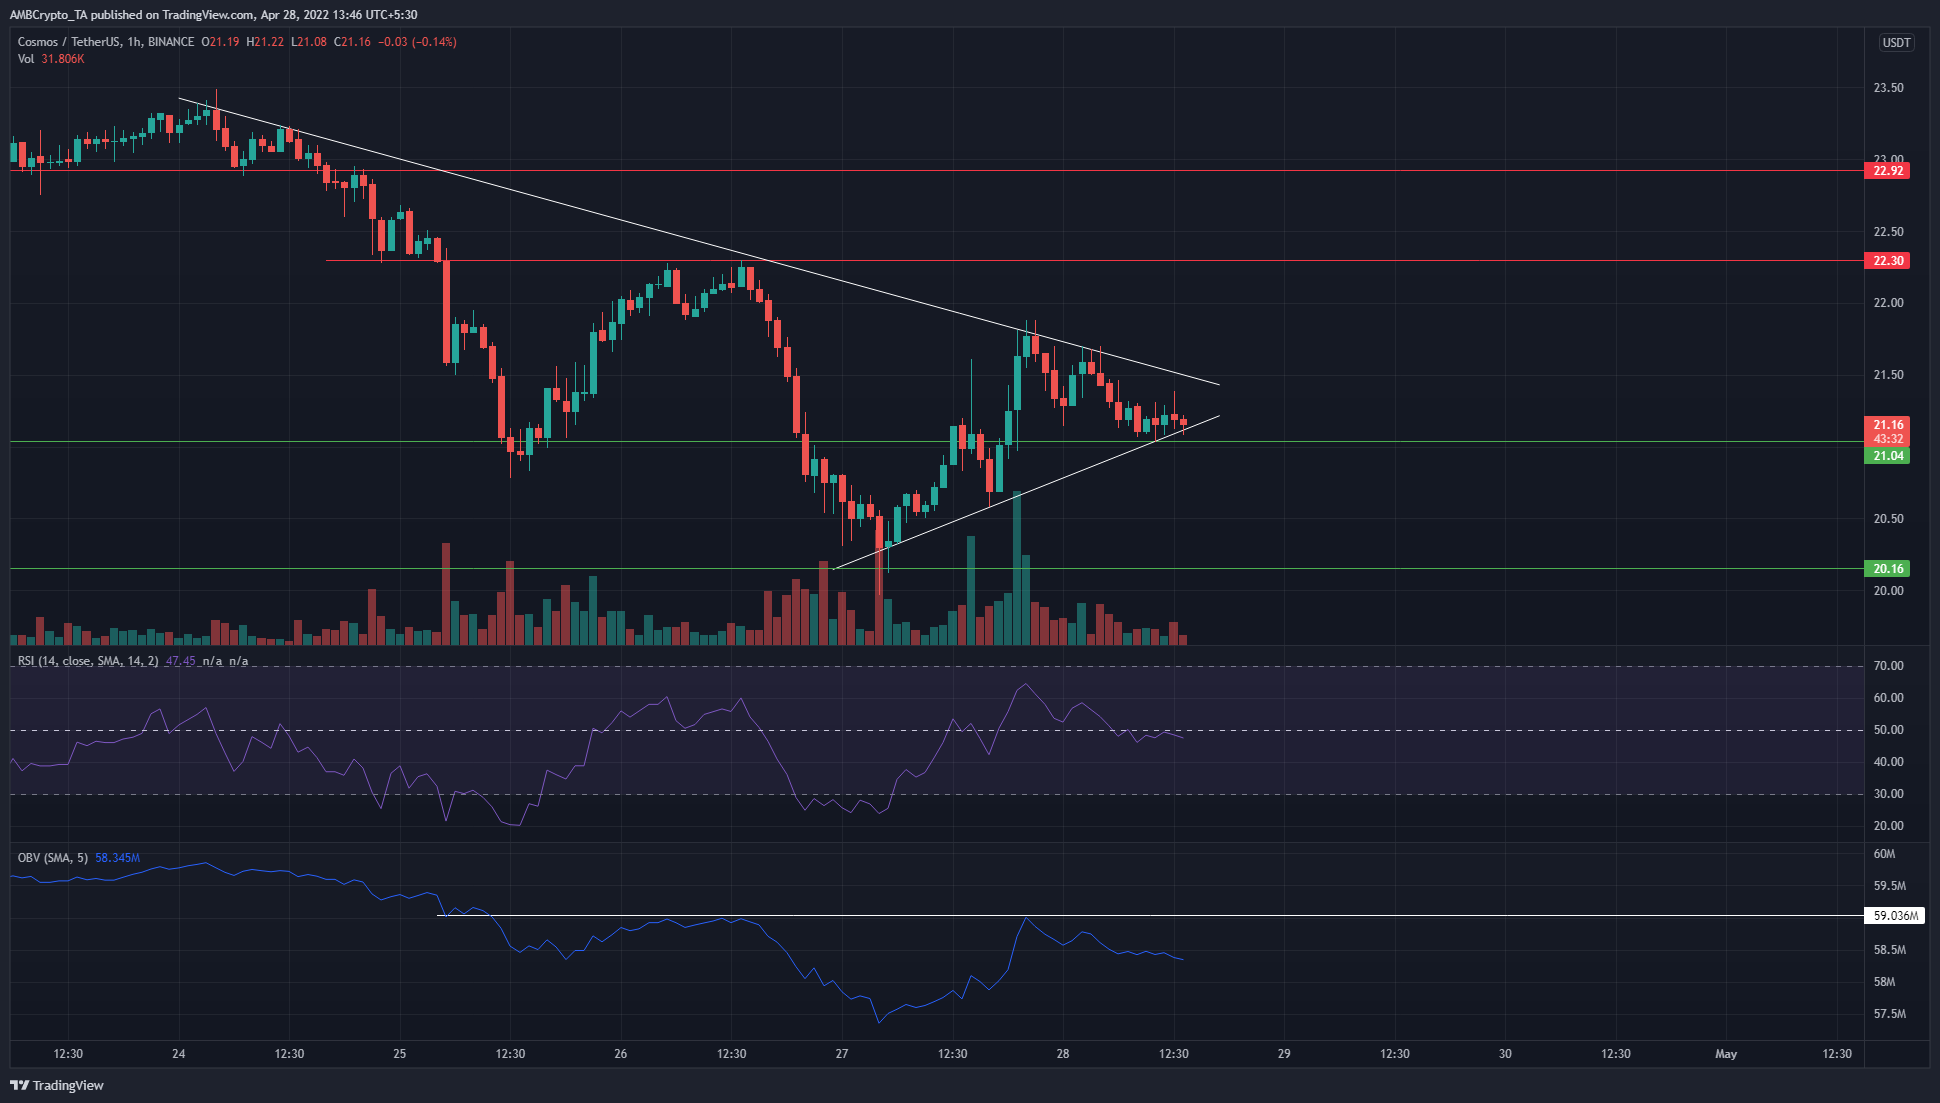
ATOM appeared to form a triangle pattern. This was only indicative of compression on the price charts before its next major move. Evidence at hand showed that a downward move was more likely.
The RSI was a fence straddler as it hovered around the neutral 50 line in the past few hours. Like the price, the RSI was indecisive too. The OBV presented a clearer picture.
In white is a horizontal resistance on the OBV, and this level has been tested on the OBV the previous day, followed by a rejection. Hence, it highlighted how sellers were still dominant in the market. There is also a support level at $21.04, and a session close beneath this level could see ATOM dive toward $20.