Solana must do the following for another 20% jump in 24 hours

Disclaimer: The findings of the following analysis are the sole opinions of the writer and should not be taken as investment advice
After overcoming some hurdles over the past week, Solana was back among the gainers. A 13% surge over the last 24 hours was timely after SOL negotiated past certain lows. Trading around the upper trendline of a down-channel at press time, a breakout seemed to be well within reach – One which could trigger further upside and mark an end to a corrective phase.
However, SOL needs to close above a critical zone to expand its gains. If profit-taking is observed, SOL would decline to the lower boundary of its pattern.
At the time of writing, SOL was trading at $149.7 and held the seventh position on CoinMarketCap’s charts.
Solana 4-hour Chart
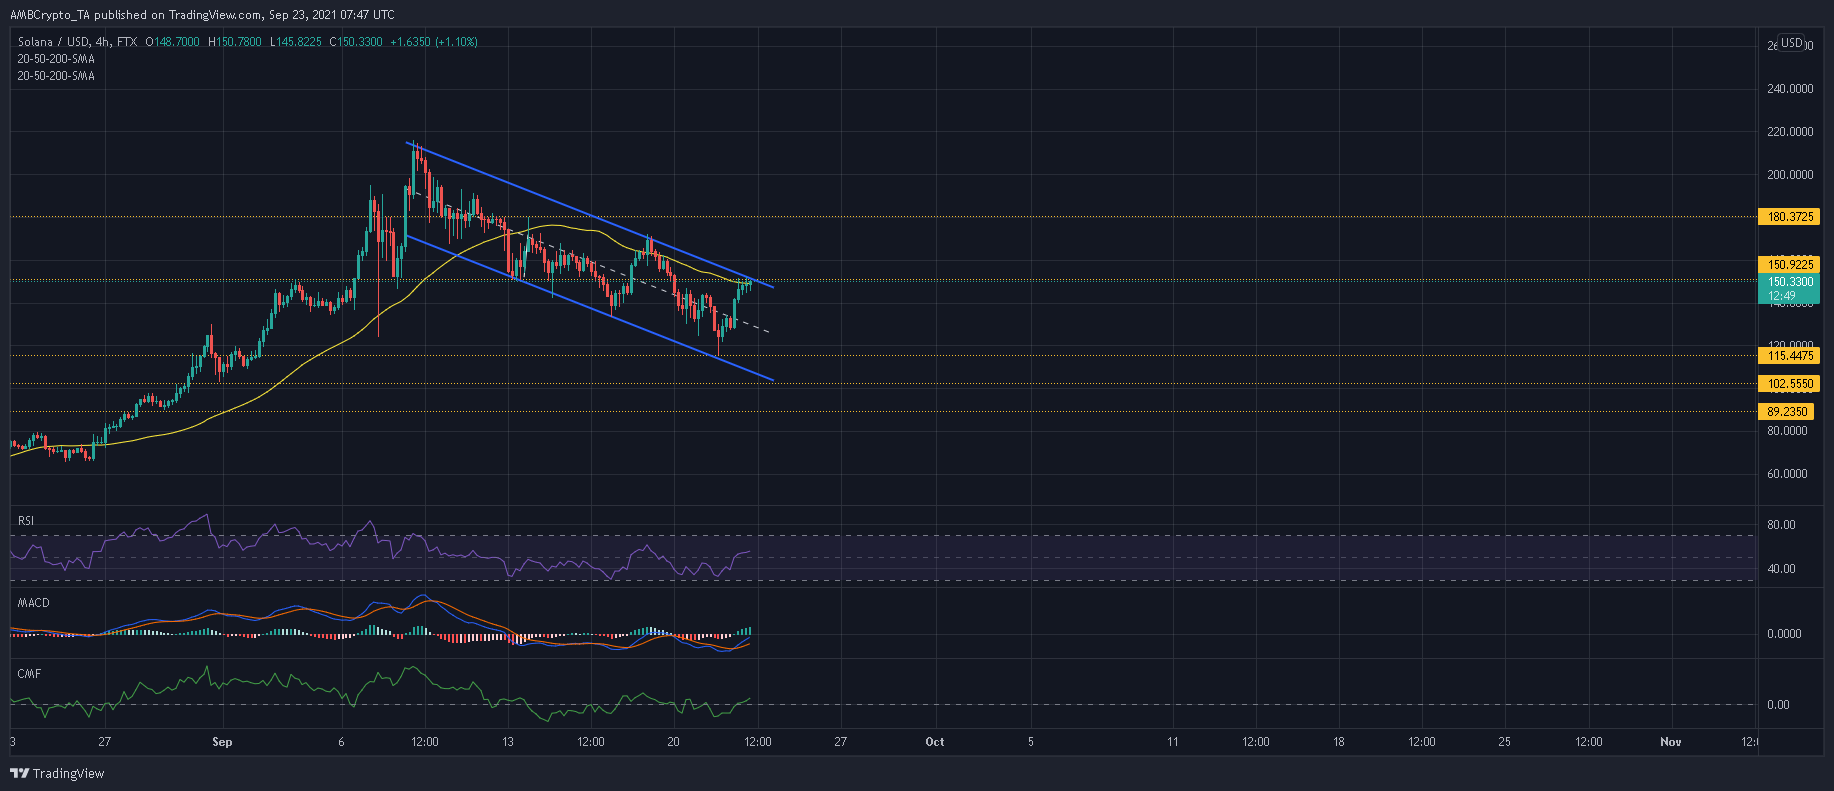
After snapping a near 3-wk low at $115.4, a 30% rally ensued. This pushed SOL to the upper boundary of its pattern. From this point, SOL had the potential for another 20% jump to 13 September’s swing high of $180.3. Price levels of $195 and $216 would then be within reach.
In order to achieve this scenario, SOL needs to close above the confluence of the $151-resistance, the 50-SMA (yellow), and the upper trendline on strong volumes.
If such an outcome is not observed over the next 24 hours, SOL would be under the threat of a sell-off towards the lower trendline and a possible breakdown. Fresher lows can be reached at $102.5 or $89.5.
Reasoning
While SOL’s indicators were recovering from bearish grounds at press time, it was too early to call for a breakout. Even though the RSI penetrated bullish territory, it was yet to rise above 60 and convince observers of a strengthening trend.
Similarly, a bullish crossover in the MACD suggested some upside. However, since SOL was within a downtrend, such signals would attract only a limited number of buyers.
On the plus side, the Chaikin Money Flow made its way above the half-line – A sign that capital inflows were generating some pace over the last few sessions.
Conclusion
Since SOL witnessed a strong rally, profit-taking will be a major threat going forward. The resistance level of $151, the 50-SMA (yellow), and the upper trendline offered a platform for traders to exit their positions and lock in some gains.
Such a case would see SOL revisit lows at $102.5 or even $89.5. Although evidence of an upwards breakout seemed to be inconclusive, an extended hike would be an outside possibility.
A close above $151 would be required for this extended jump. The 24-hour trading volumes and aforementioned indicators would lend more clarity to this outcome.


