Solana [SOL]: Close above this pattern can initiate a breakout rally

Disclaimer: The findings of the following analysis are the sole opinions of the writer and should not be considered investment advice.
Solana’s [SOL] south-looking trajectory has tracked itself within the bounds of its two-month down-channel (yellow). Also, the alt has struggled to maintain a spot above the 20 EMA (red) in the daily timeframe. The recent reversal from the 38.2% Fibonacci level could aid the near-term selling endeavors.
A bounce-back from the lower trendline of the down-channel can open doorways for a short-term recovery. At press time, SOL was trading at $35.1425.
SOL Daily Chart

SOL’s constant reversal from the upper trendline of the down-channel has pulled the alt below its near-term EMAs. The south-looking tendencies of the 20/50 EMA have impaired the buying rallies.
Over the last two months, the 50% and the 38.2% Fibonacci resistances have assumed an important area of value. The bulls have been striving to recoup their vigor but the bearish pulls have only found fresher lows.
The price action now seemed to consolidate near the Point of Control (POC, red). An inability of the buyers to inflict a strong rally could only aid the sellers in extending the sluggish phase.
A continued devaluation could help the bears in testing the $30-zone before a potential bounce back. A rebound from this level could hint at a retest of the POC region in the $38 zone. But a convincing close above the pattern was still needed for the bulls to inflict a breakout rally in the days to come.
Rationale
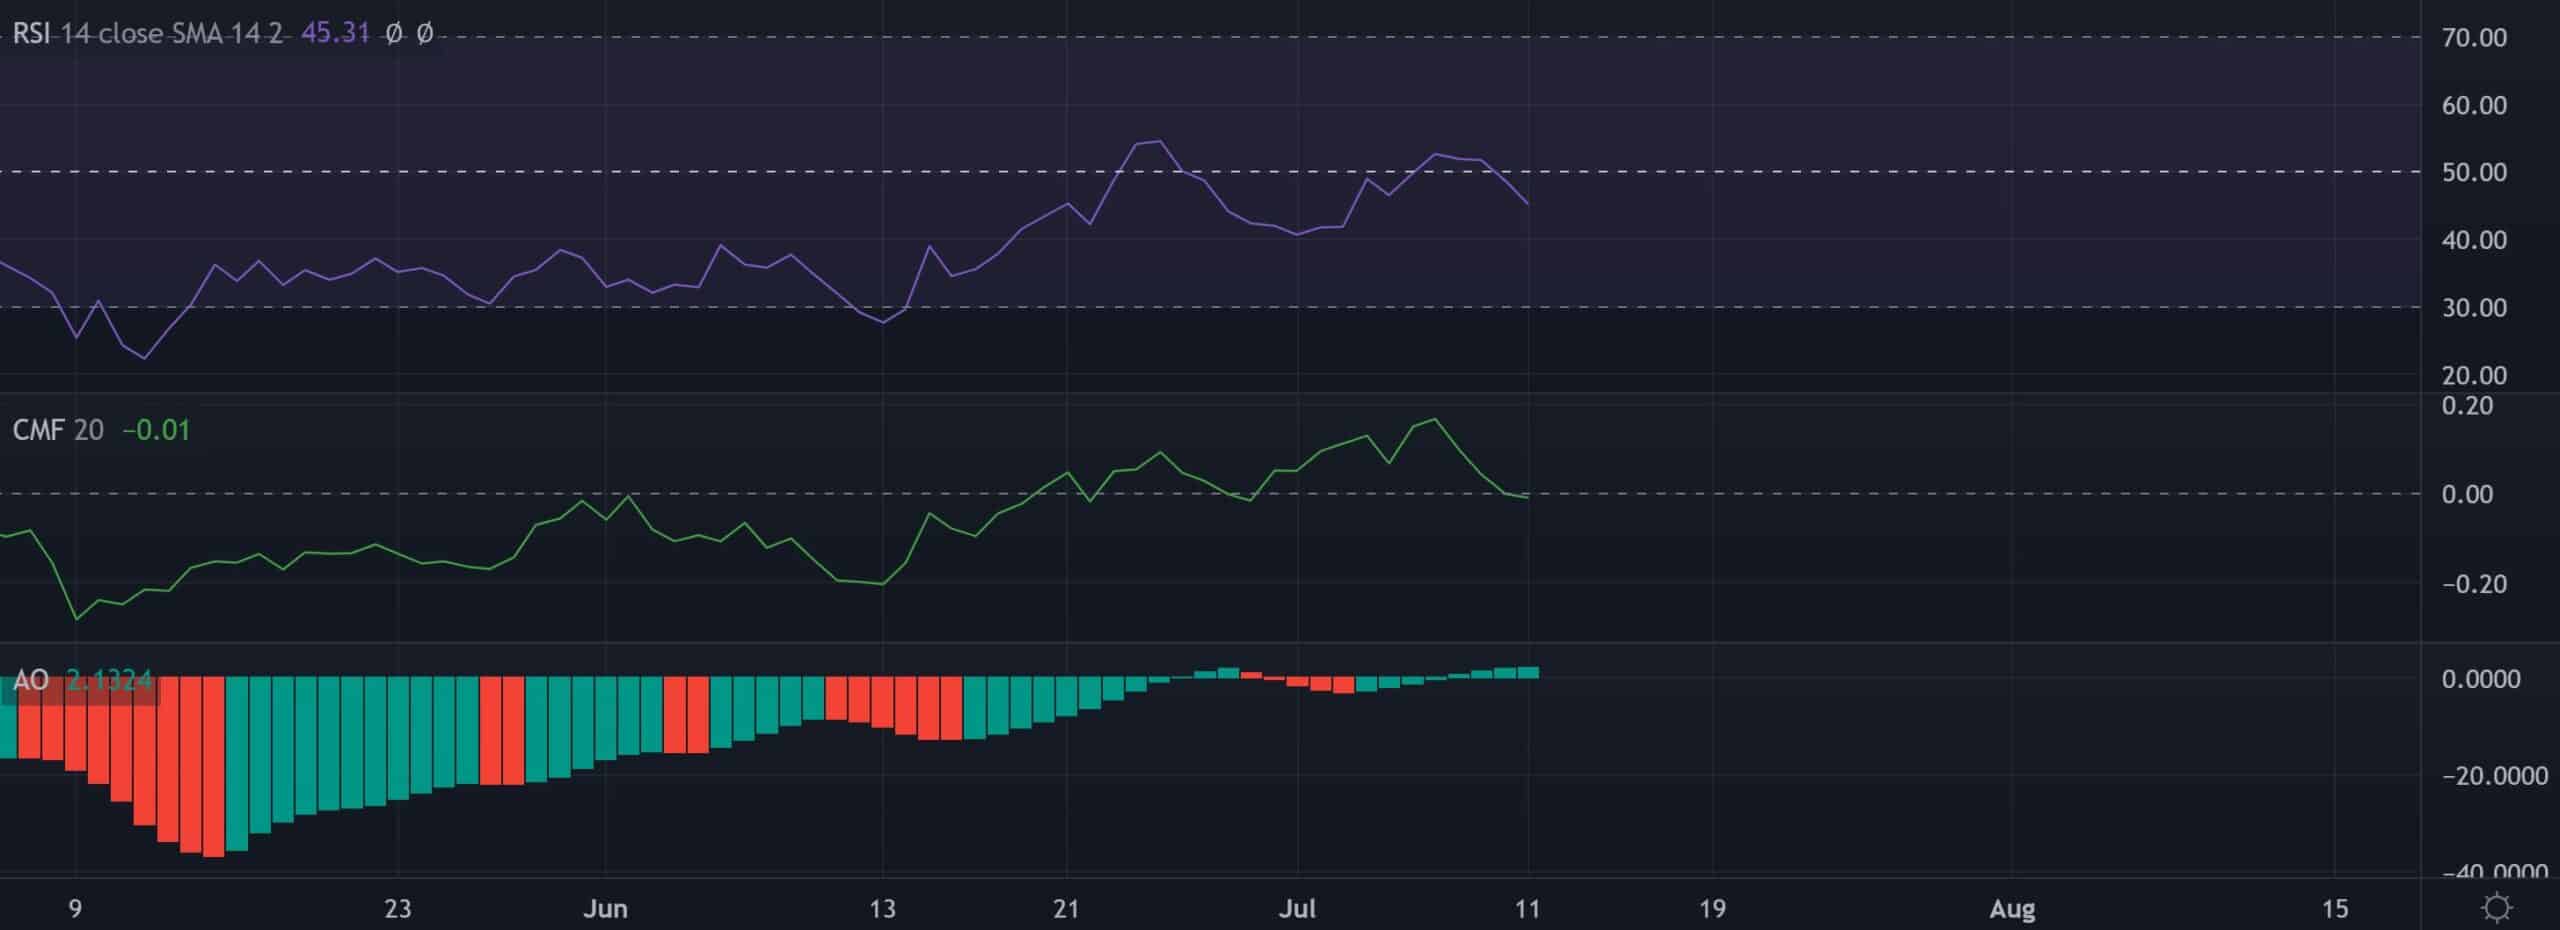
The Relative Strength Index (RSI) failed to find a spot beyond the midline resistance over the last few days. In light of its sideways tendencies, buyers still have a long way to transform the broader bearish outlook.
Further, the CMF has been testing the zero-mark for nearly three weeks now. A robust close below this mark would aid the sellers in extending the ongoing onslaught.
Interestingly, the AO finally found a spot above its equilibrium. A sustained position above this level would indicate a gradual shift of momentum in favor of buyers.
Conclusion
Given the bearish structure near its south-looking EMAs, SOL could see setbacks while continuing its patterned movements. The triggers and take-profit levels would remain the same as above.
However, investors/traders must keep a close eye on Bitcoin’s [BTC] movement to determine its effects on the broader sentiment.


