
Several alts were restricted below key levels as Bitcoin remained under the $60k-mark. Solana and Luna traded below $50 and $19.5, respectively. On the other hand, AAVE rose steadily over the last few days and a breakout above $537 was on the cards.
Solana [SOL]
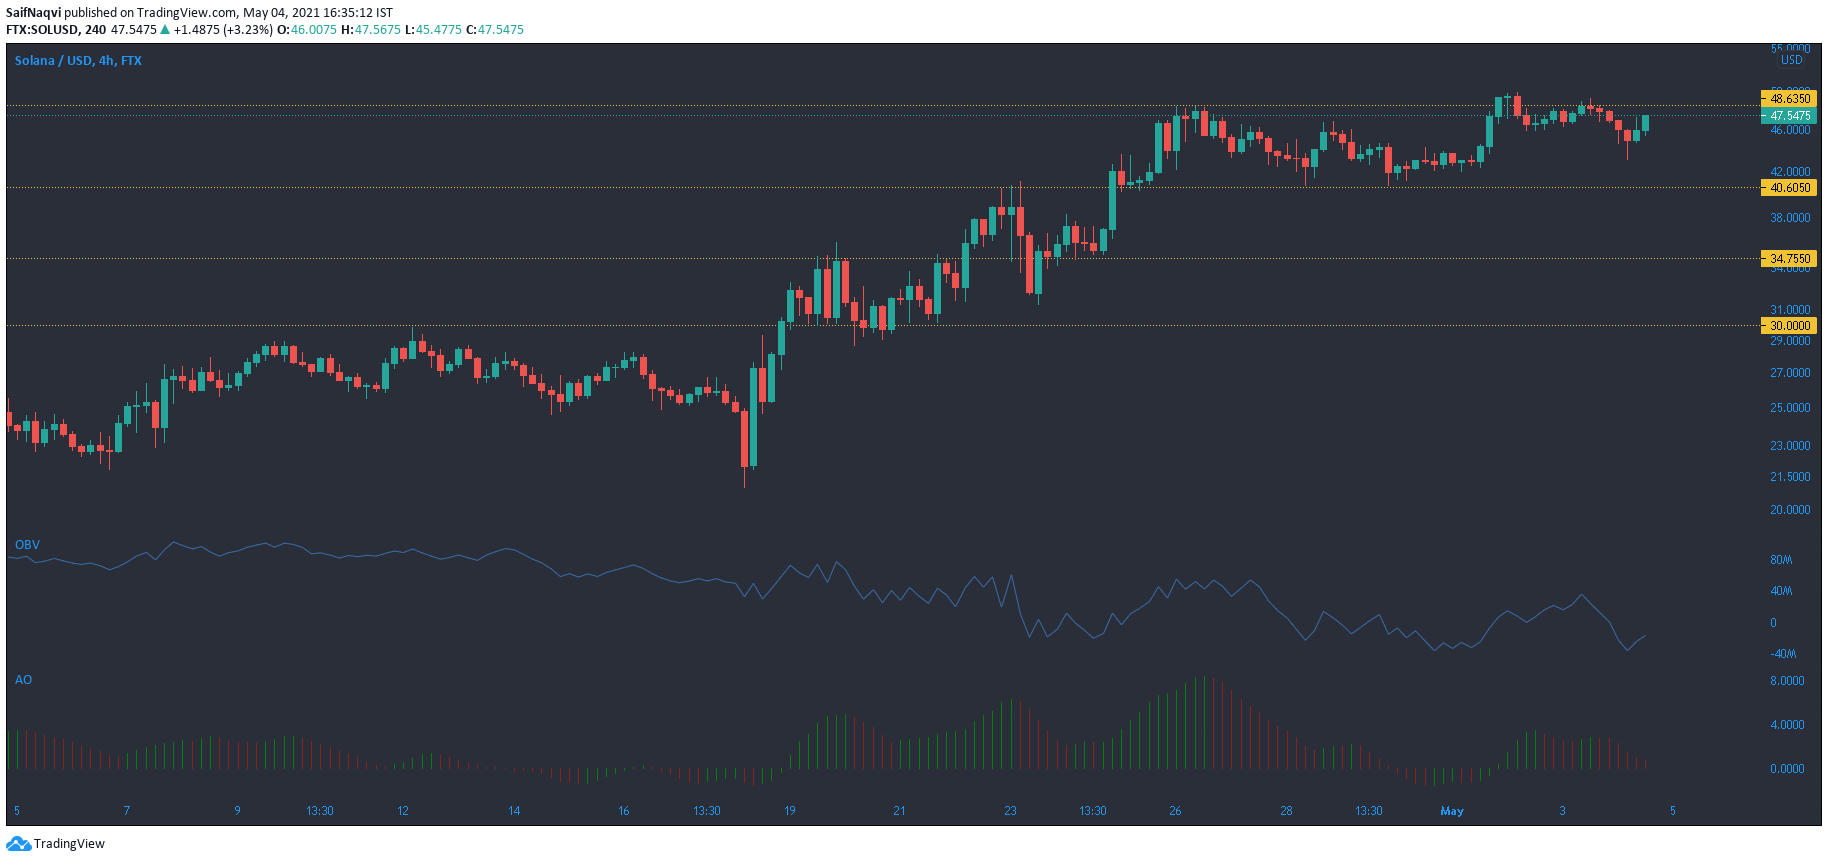
Source: SOL/USD, TradingView
Solana saw buying at both $21 and $30 as the buyers pushed it towards the $50-mark. However, the last few days noted choppy movement and the price oscillated between $40-50. Maintaining the lower range would be bullish over the short-medium term as this would allow for a breakout above $50.
OBV showed periods of selling pressure followed by buying pressure as the index showed erratic movement. Awesome Oscillator moved towards the half-line as momentum sided with the bearish side. This was not a worrying sign just yet but as retreated earlier, support at $40 must be defended to avoid a bearish outcome.
Terra [LUNA]
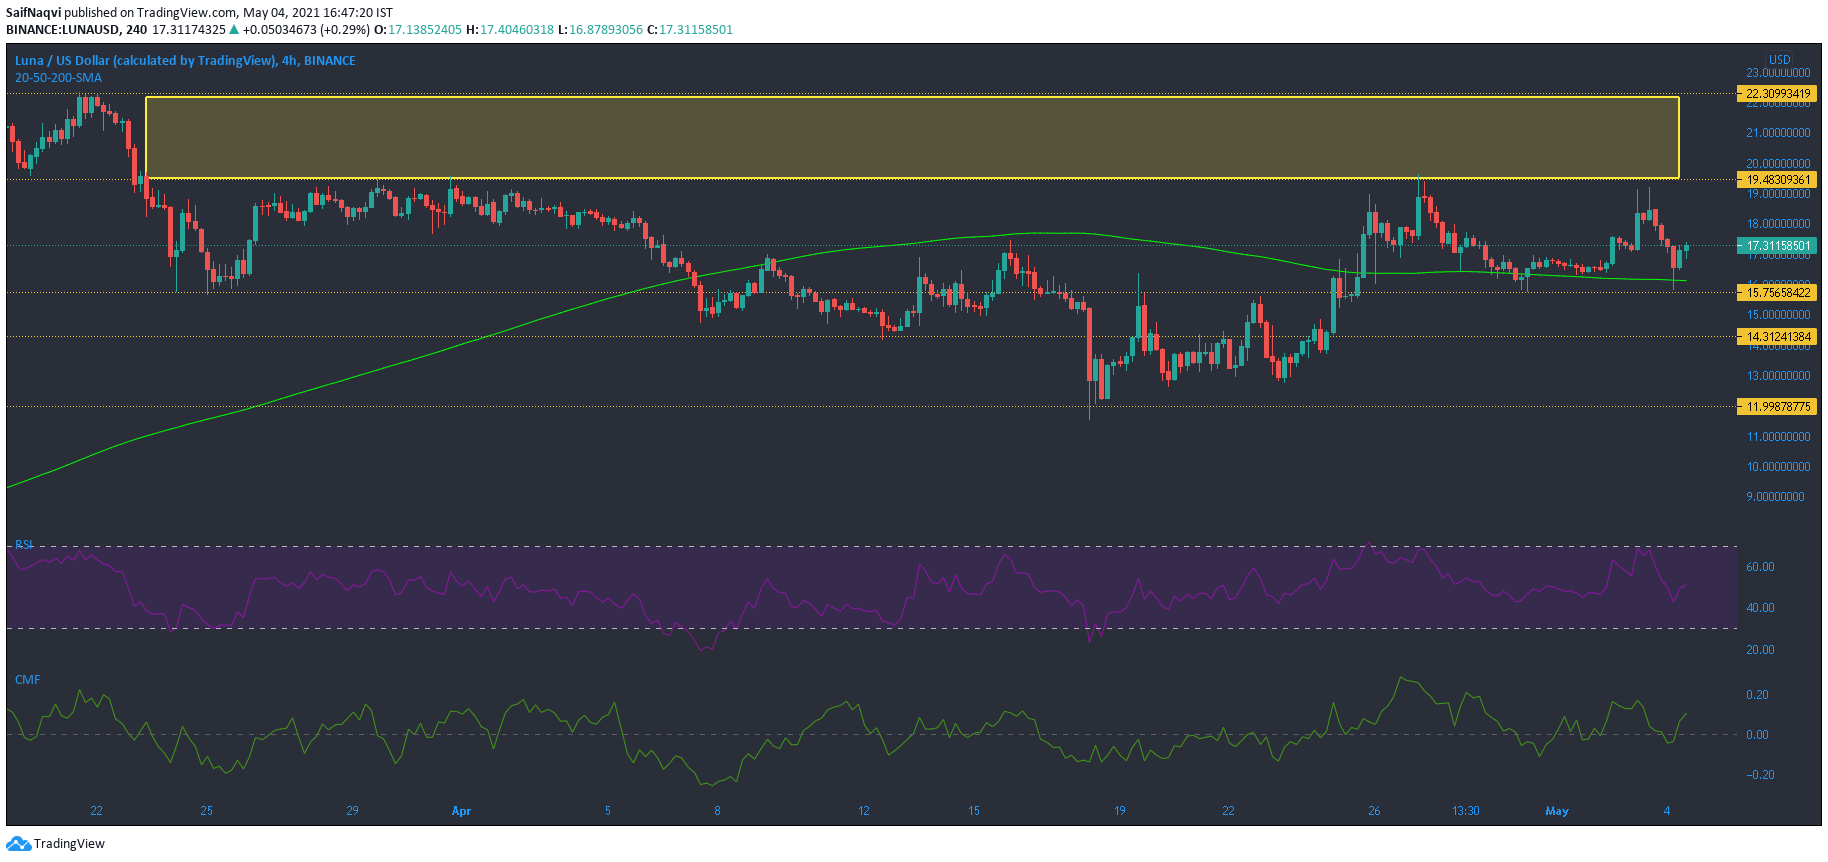
Source: LUNA/USD, TradingView
Since a pullback during the last week of March, Terra has struggled to break above $19.5. Selling has been around this point on multiple occasions and while the candlesticks did rise above their 200-SMA, bullish sentiment was not enough for a sharp surge in the market. At the time of writing, the price was supported by the 200-SMA and the hourly timeframe showed a steady rise. However, muted trading volumes meant that a breakout above $19.5 was not yet a possibility.
RSI pointed north from the neutral zone but a rise towards the upper region was unlikely. Meanwhile, CMF showed a strong correlation with price. A rise above the half-line and healthy capital inflows was a plus moving forward.
Aave [AAVE]
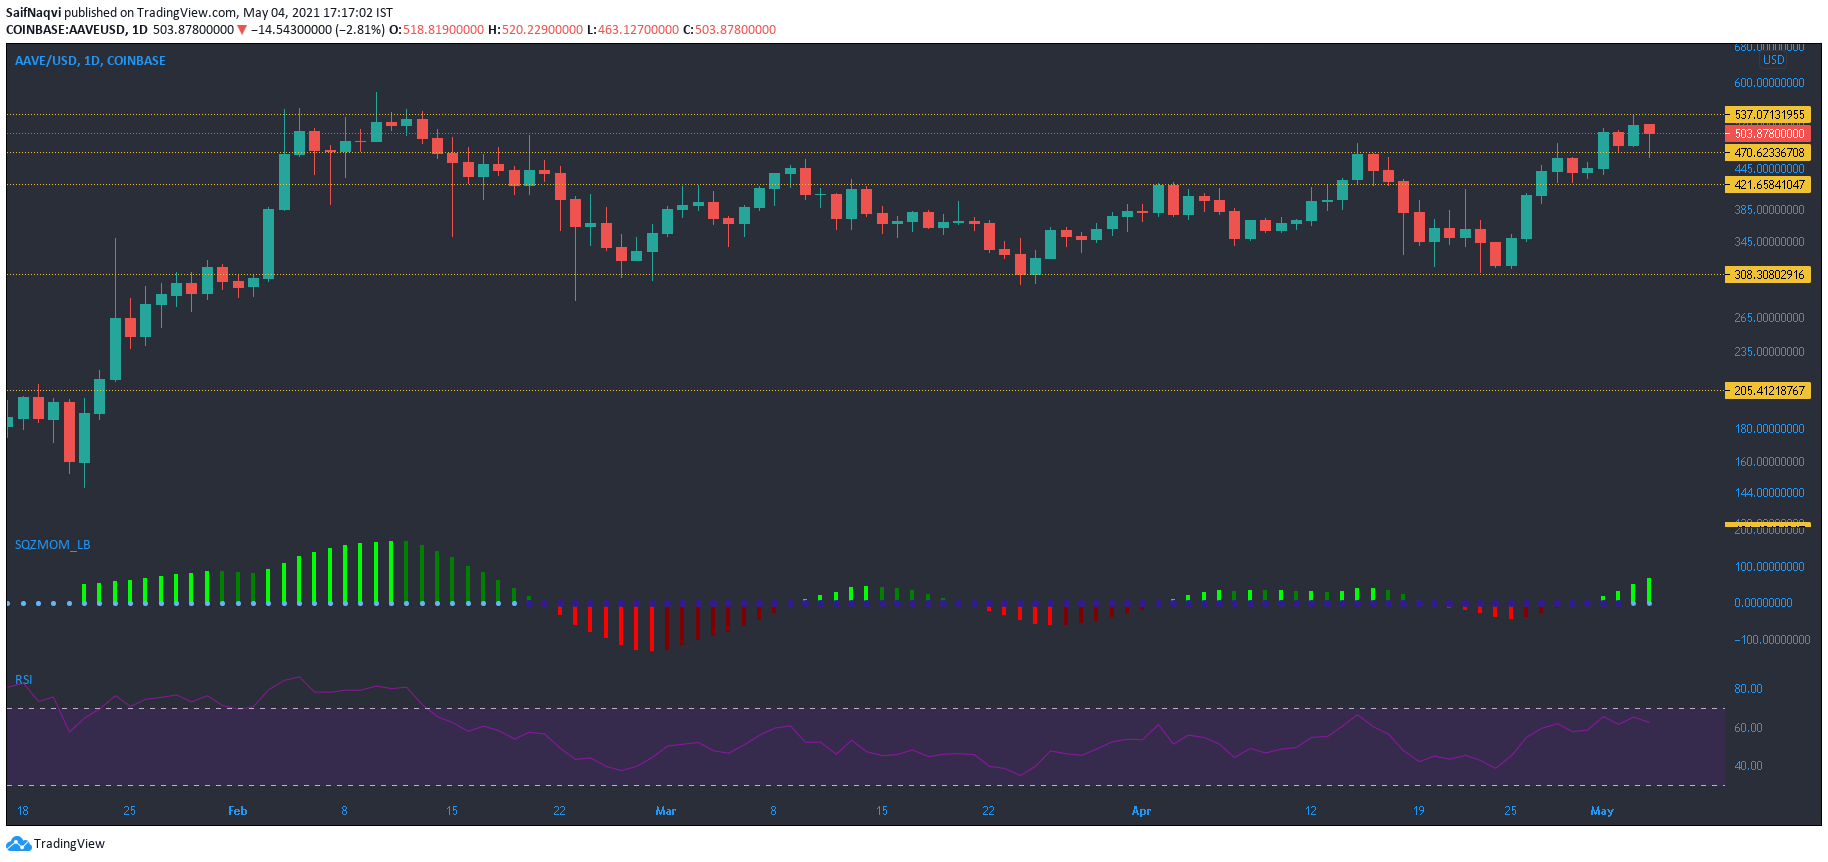
Source: AAVE/USD, TradingView
Since a rally in early February, several pullbacks have been observed in the Aave market. These pullbacks have been maintained by a strong support region present around $308. This area has proven to be a strong base for buying activity, and the most recent rally lay testament to that fact. However, resistance at $537 has also limited gains for AAVE. On the daily timeframe, a red candlestick appeared as the rally closed in on this upper ceiling.
According to Squeeze Momentum Indicator, the market highlighted a squeeze release, and this indicated rising volatility. A pickup in the 24-hour trading volume was a positive sign and all eyes would be on the $537 barrier over the next few days. In case of a breakout, levels to look out for include $580 and $660. RSI traded below 60 but still maintained a bullish territory.