Solana traders can capitalize on this ‘perfect opportunity’ to buy the dip

Disclaimer: The findings of the following analysis are the sole opinions of the writer and should not be taken as investment advice
Solana seems to have taken a breather after an astounding surge in value to an ATH of $82. Lower highs and lower lows were observed on SOL’s 4-hour timeframe, at press time, as the altcoin maintained movement within a downtrend. However, this offered traders an opportunity to bag SOL at a discounted price level before the next rally.
Some entry areas were identified on the chart and a cautionary note was placed around $58.
At the time of writing, SOL was trading at $67.5 with a market capitalization of $19.72 billion.
Solana 4-hour chart
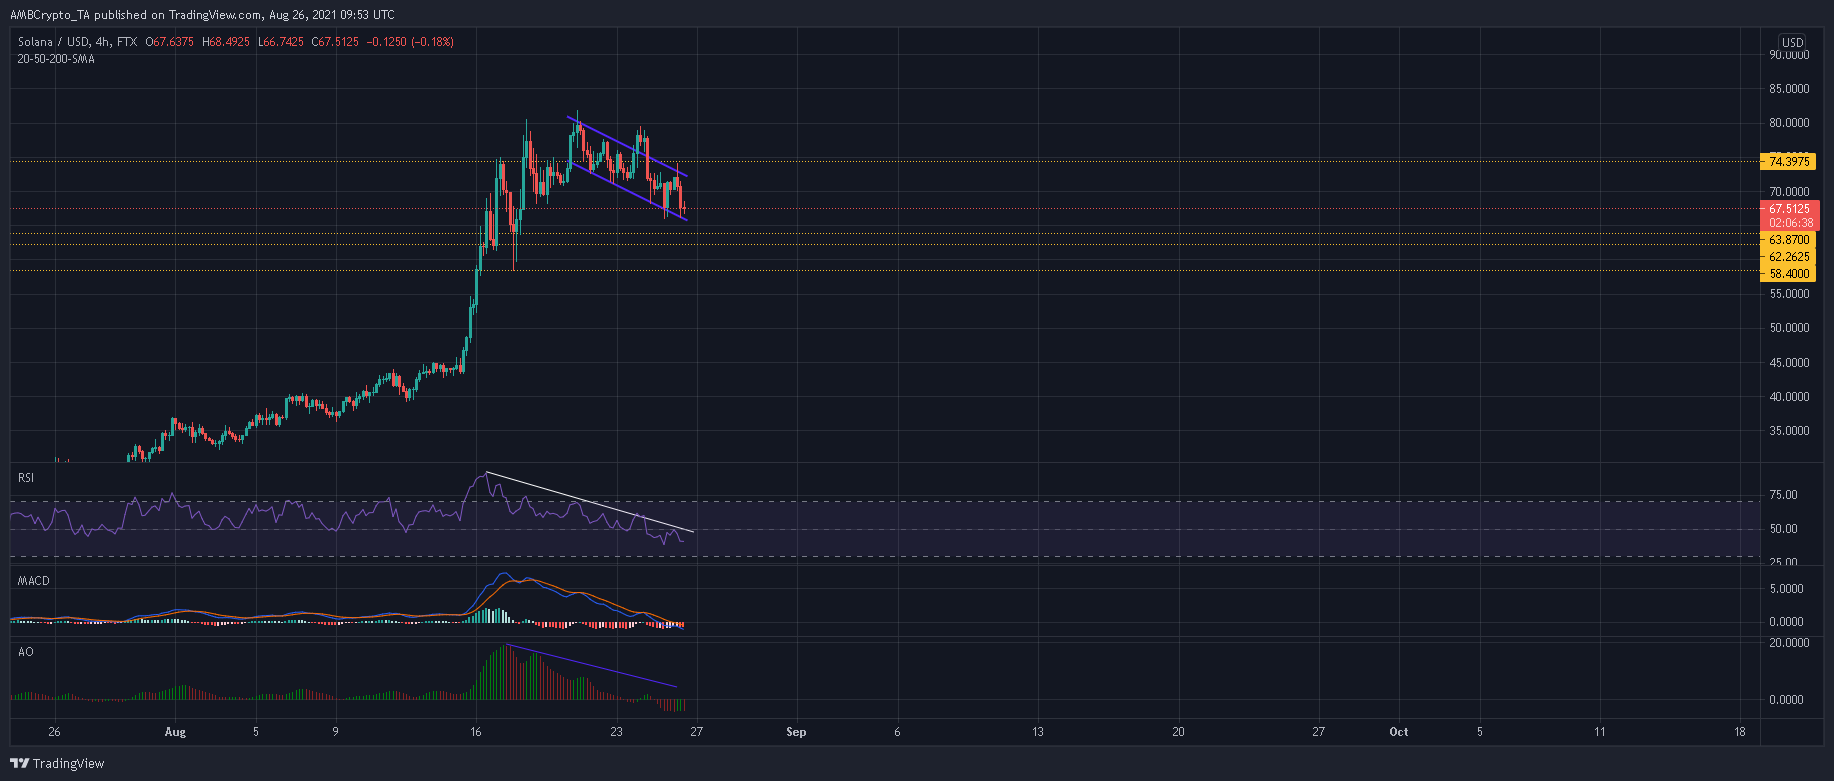
SOL continued to trade within a down-channel after an impulsive breakout was met with immediate rejection at $80. A lower low formed below $64 would pave way for short-sellers to initiate further drawdowns. From that point, buyers would need to be cautious of a close below $58 as this would hamper SOL’s overall trajectory.
While an unfavorable outcome seemed to be on the cards, it’s important to note certain developments on SOL’s daily chart as well. Over the longer timeframe, SOL was gearing for a bull flag breakout. This suggested that press time retracements were well within a bullish long-term projection.
From here on, significance can be attached to a few levels that might trigger a bullish reversal. The first and arguably the most important zone lay between $66-$67.6. The second was identified at around $64. Both these levels have triggered minor rallies on previous occasions and can be expected to match up to the selling pressure.
Reasoning
The RSI seemed to be forming two narratives on different timeframes. While the 4-hour RSI moved within a downtrend and traded below 40, the daily RSI was well within the bullish territory. This meant that chances of near-term decline were high, but bulls can be expected to maintain an overall grip on proceedings.
The 4-hour Awesome Oscillator and MACD traded below their half-lines but such findings are not extraordinary within a down-channel. If SOL finds support at the aforementioned regions, expect these indicators to climb back above their equilibrium levels.
Conclusion
While SOL presented chances of a further near-term decline, buyers had a window to grab SOL at a discounted level. Regions between $64-$66 would be ideal zones to go long as SOL prepares for a bull flag breakout on its daily chart.
Nevertheless, there are some vulnerabilities that could translate into another correction if SOL closes below $64.


