Solana traders must identify these signs of a possible 5% decline

Disclaimer: The findings of the following analysis are the sole opinions of the writer and should not be taken as investment advice
Solana seemed to be settling down on the charts after a busy week of trade. In its push towards a new ATH, Solana faced little opposition at the 23.6% and 50% Fibonacci extensions. However, signs of exhaustion had seeped into the market.
Buyers now need to fend off selling pressure in certain areas to maintain their advance. At the time of writing, SOL was being traded at $72.5, down by 7% over the last 24 hours.
Solana 4-hour chart
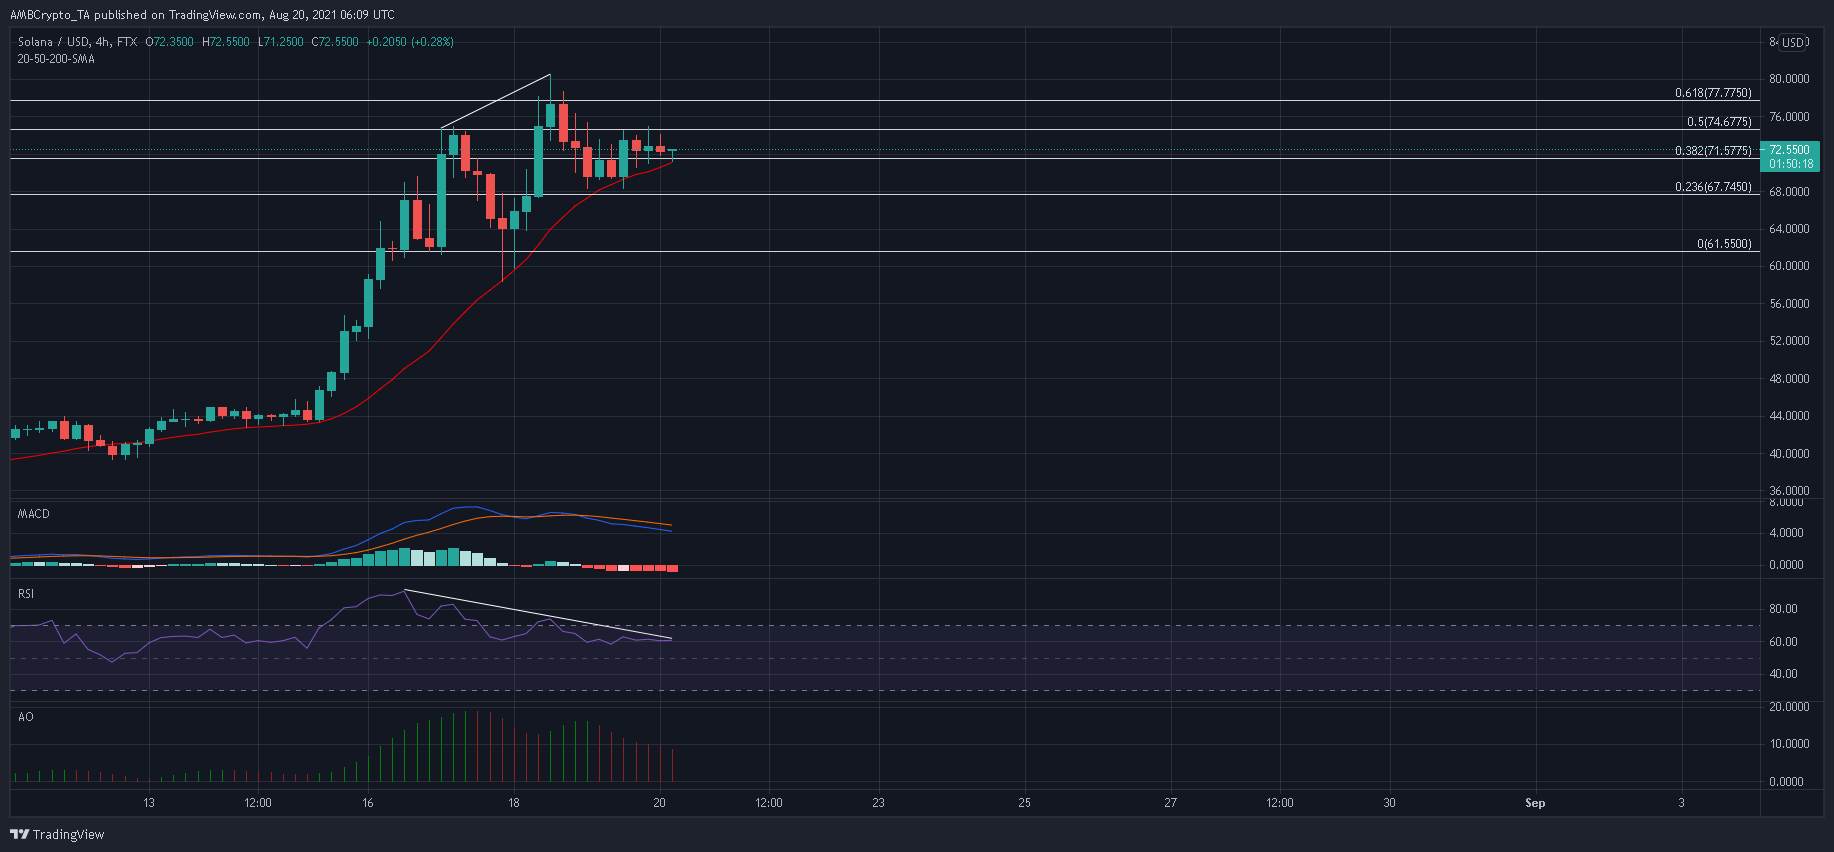
The 38.2% Fibonacci Level has been an area of contention over the past couple of days as the price found a resting ground before the next swing. The 20-SMA (red) also had a role to play in SOL’s price discovery. The short-term moving average line ran bullish and spurred buying on multiple occasions.
With volatility now easing, SOL could trade sideways and above the 38.2% Fibonacci level before the next upcycle. On the other hand, a 5.3% decline may be in the offing if SOL closes below the aforementioned level and 20-SMA.
Reasoning
The indicators had not yet switched their bullish stance but did sound a few alarm bells in the market. The RSI highlighted a bit of a divergence after forming three lower peaks as SOL’s move to its ATH lacked conviction. A move below 40 would signify the onset of a downtrend.
The Awesome Oscillator formed a bearish twin peak – A setup that is usually followed by a surge in selling pressure. Finally, the MACD’s downwards trajectory was also a worrying sign. However, fears of an extended sell-off would be alleviated if it stays above equilibrium.
Conclusion
Declining volatility and trading volumes could see Solana move sideways over the coming sessions and above its 38.2% Fibonacci Level. This would allow traders to maintain their advance at higher levels. However, traders must be cautious of a close below the 20-SMA as this might trigger another 5% decline to the next support at $67.7.