Solana’s corrections present ‘ideal’ opportunity to go long over here

Disclaimer: The findings of the following analysis are the sole opinions of the writer and should not be taken as investment advice
Solana has capped an excellent week of trade after registering an ROI of 18% – The second-highest gainer among the top-10 coins by market cap. On the charts, SOL has embarked on a steady uptrend since rebounding from the 61.8% Fibonacci level ($177.5), with the alt continuing to target fresh milestones.
However, a near-term correction has come to light following bearish divergences along the RSI, MACD, and the Awesome Oscillator. For traders, this presents an ideal opportunity to get in on the SOL rally at a discounted price level.
At the time of writing, SOL was trading at $245.2, down by 4% over the last 24 hours.
SOL 4-hour Chart
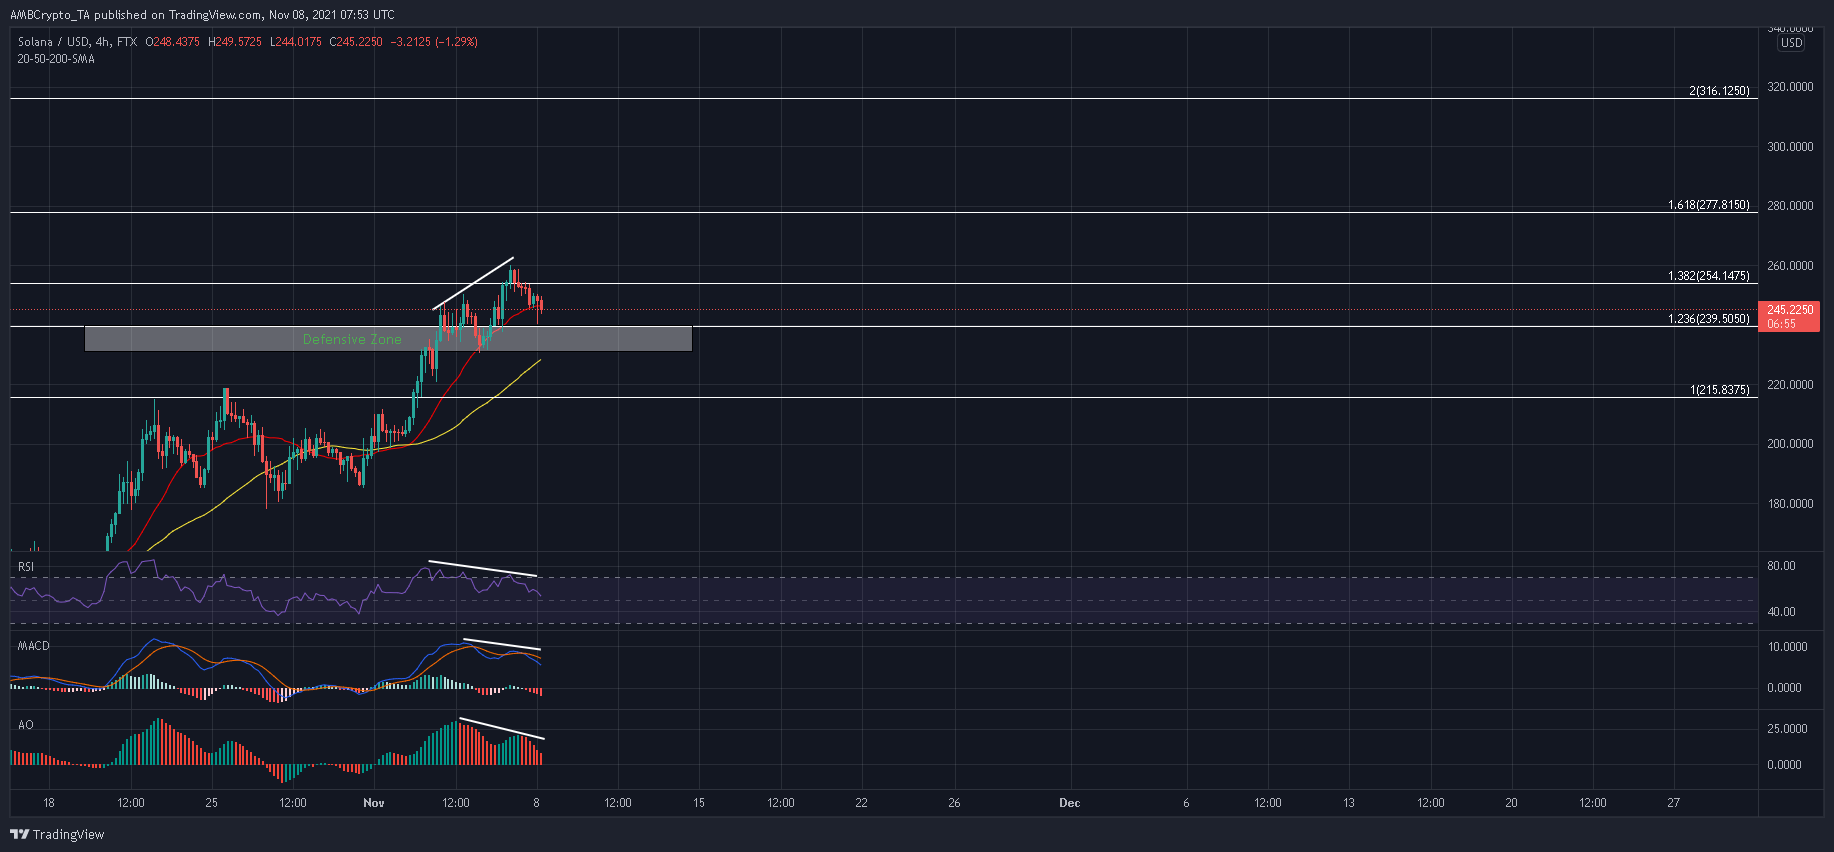
After overcoming its previous peak of $215.8 in late October, SOL recorded its next upwards wave heading into November. The $239.5 and $254.1 price levels have already been tagged, with SOL now eyeing its 200% Fibonacci Extension. However, a near-term correction was in effect following some red flags on some of SOL’s indicators.
For instance, the RSI has been forming lower peaks within the overbought territory, the Awesome Oscillator registered a bearish twin peak, and the MACD saw an unfavorable crossover. Corrections are usually heightened by such signals as sellers induce more southbound pressure. SOL also traded below its 20-SMA (red) – A sign that bears had a grip over the proceedings.
A further 2%-3% dip would allow SOL to tag its 123.6% Fibonacci level, which was its first defensive area. Should SOL reverse trajectory from this support, higher lows within its overall trend would be maintained. A deeper sell-off can be countered following a double bottom at $230.7.
Traders wishing to capitalize on SOL’s rally can long at the aforementioned support areas, although a stop-loss must be maintained at around $225 once SOL closes below its 50-SMA (yellow).
Conclusion
The present correction could extend to the 123.6% Fibonacci level or even $230.7, allowing traders to mop up SOL at a discounted price. During the next leg upwards, SOL would look to challenge the 161.8% and 200% Fibonacci levels, allowing traders to bag 15%-30% gains.