Analysis

Stellar Lumens, FTX Token, Waves Price Analysis: 18 April
Posted:
| Last updated: December 23rd, 2021
Journalist

One sign of the bears losing strength is Bitcoin, or the altcoins themselves, forming a bullish divergence on the 4-hour or higher timeframes. This is a development that traders can keep an eye out for to catch a potential bottom. Stellar Lumens nor FTX Token were nowhere close to that point yet- bears were strong, and although a dead cat bounce can be seen, further downside would not be surprising. Waves retraced back to where it was at the start of April, a clean reset.
Stellar Lumens [XLM]
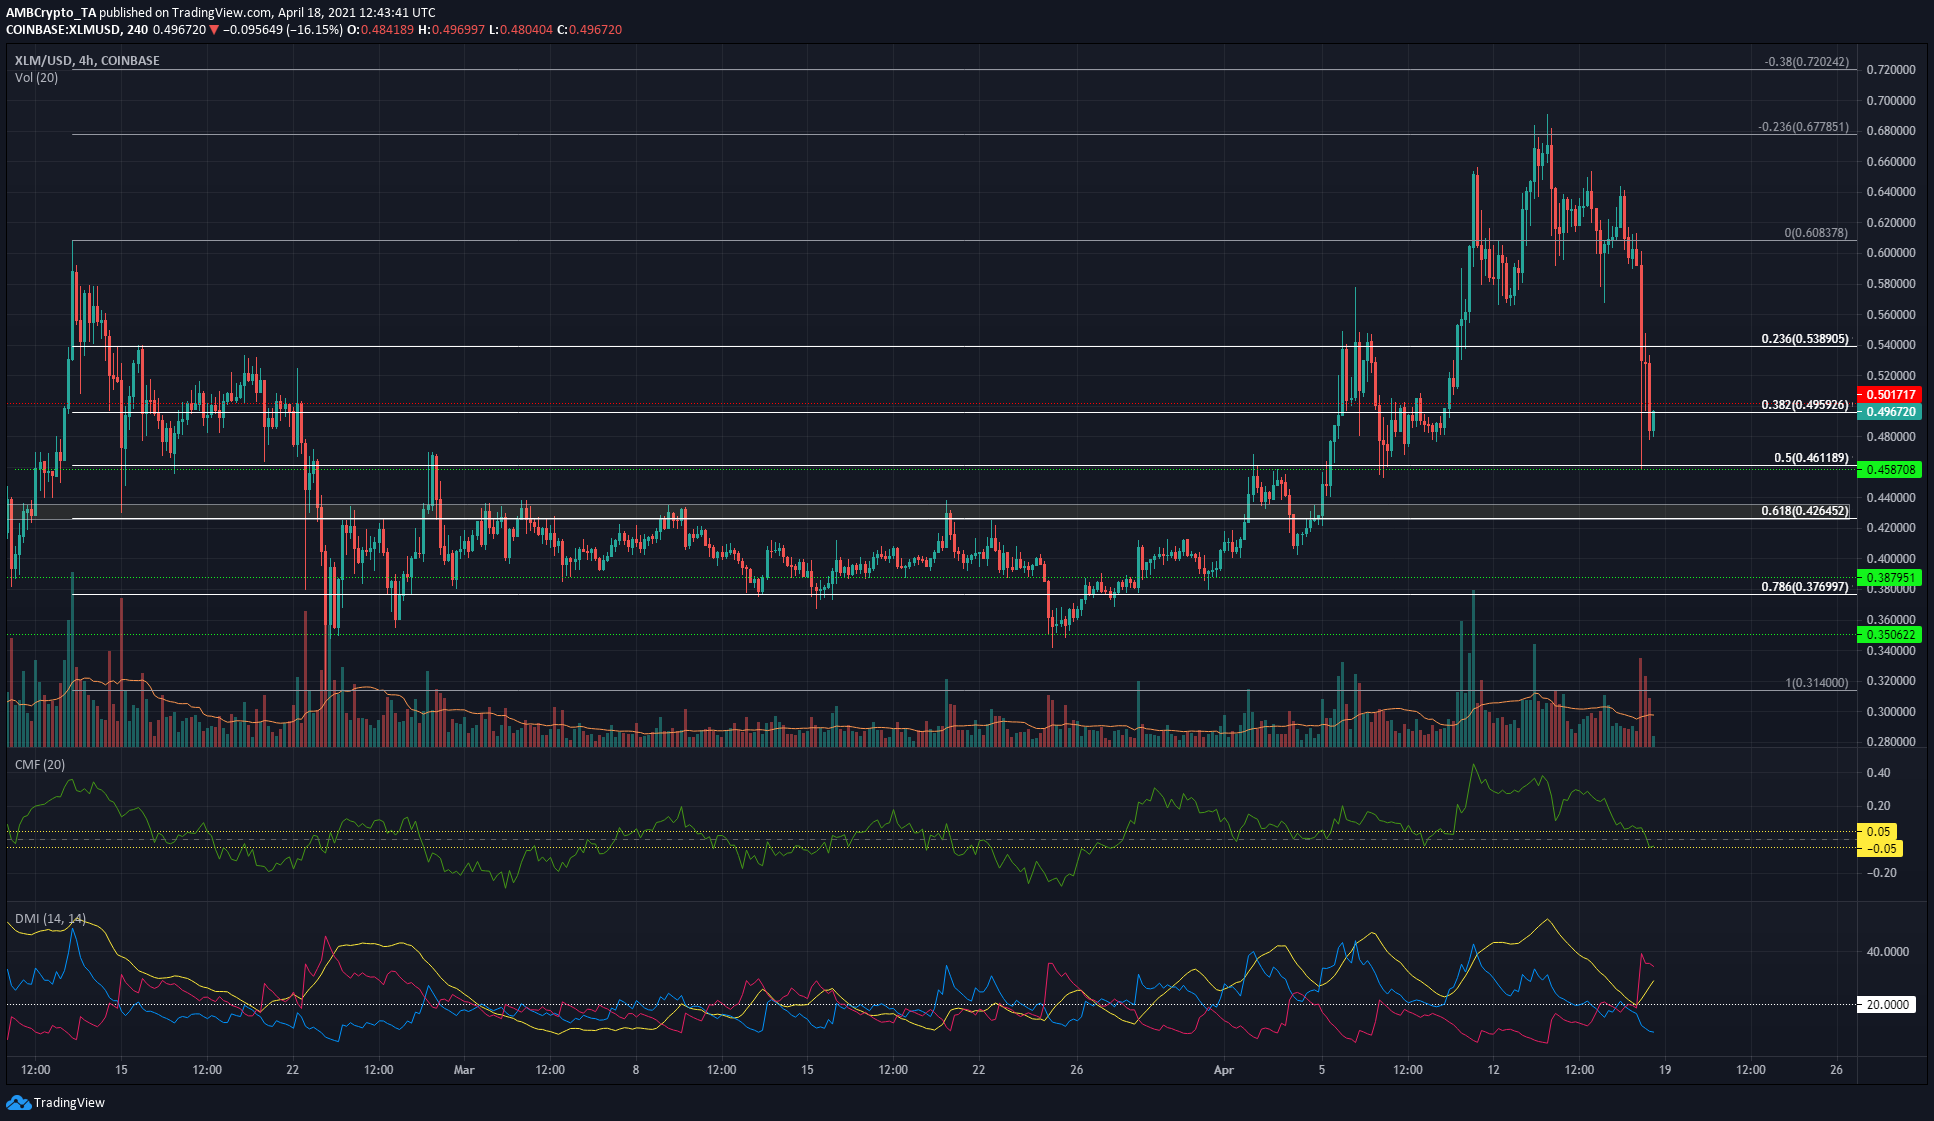
Source: XLM/USD on TradingView
Using the swing highs and lows at $0.6 and $0.314 in February, some retracement and extension levels were plotted that the price appears to respect. The 23.6% extension level acted as resistance, while the retracement levels have also acted as support and resistance.
At the time of writing, the price had sunk beneath the 38.2% level and could be headed to test the $0.46 level over the next day or two. XLM was oversold in the shorter timeframes and this could see a small relief bounce off the $0.48 mark. The Chaikin Money Flow was just above the -0.05 value, and a lower value would show net capital flow out of the market.
The DMI showed a strong downtrend had been established- the $0.48, $0.461 and $0.42 are levels to watch out for.
FTX Token [FTT]
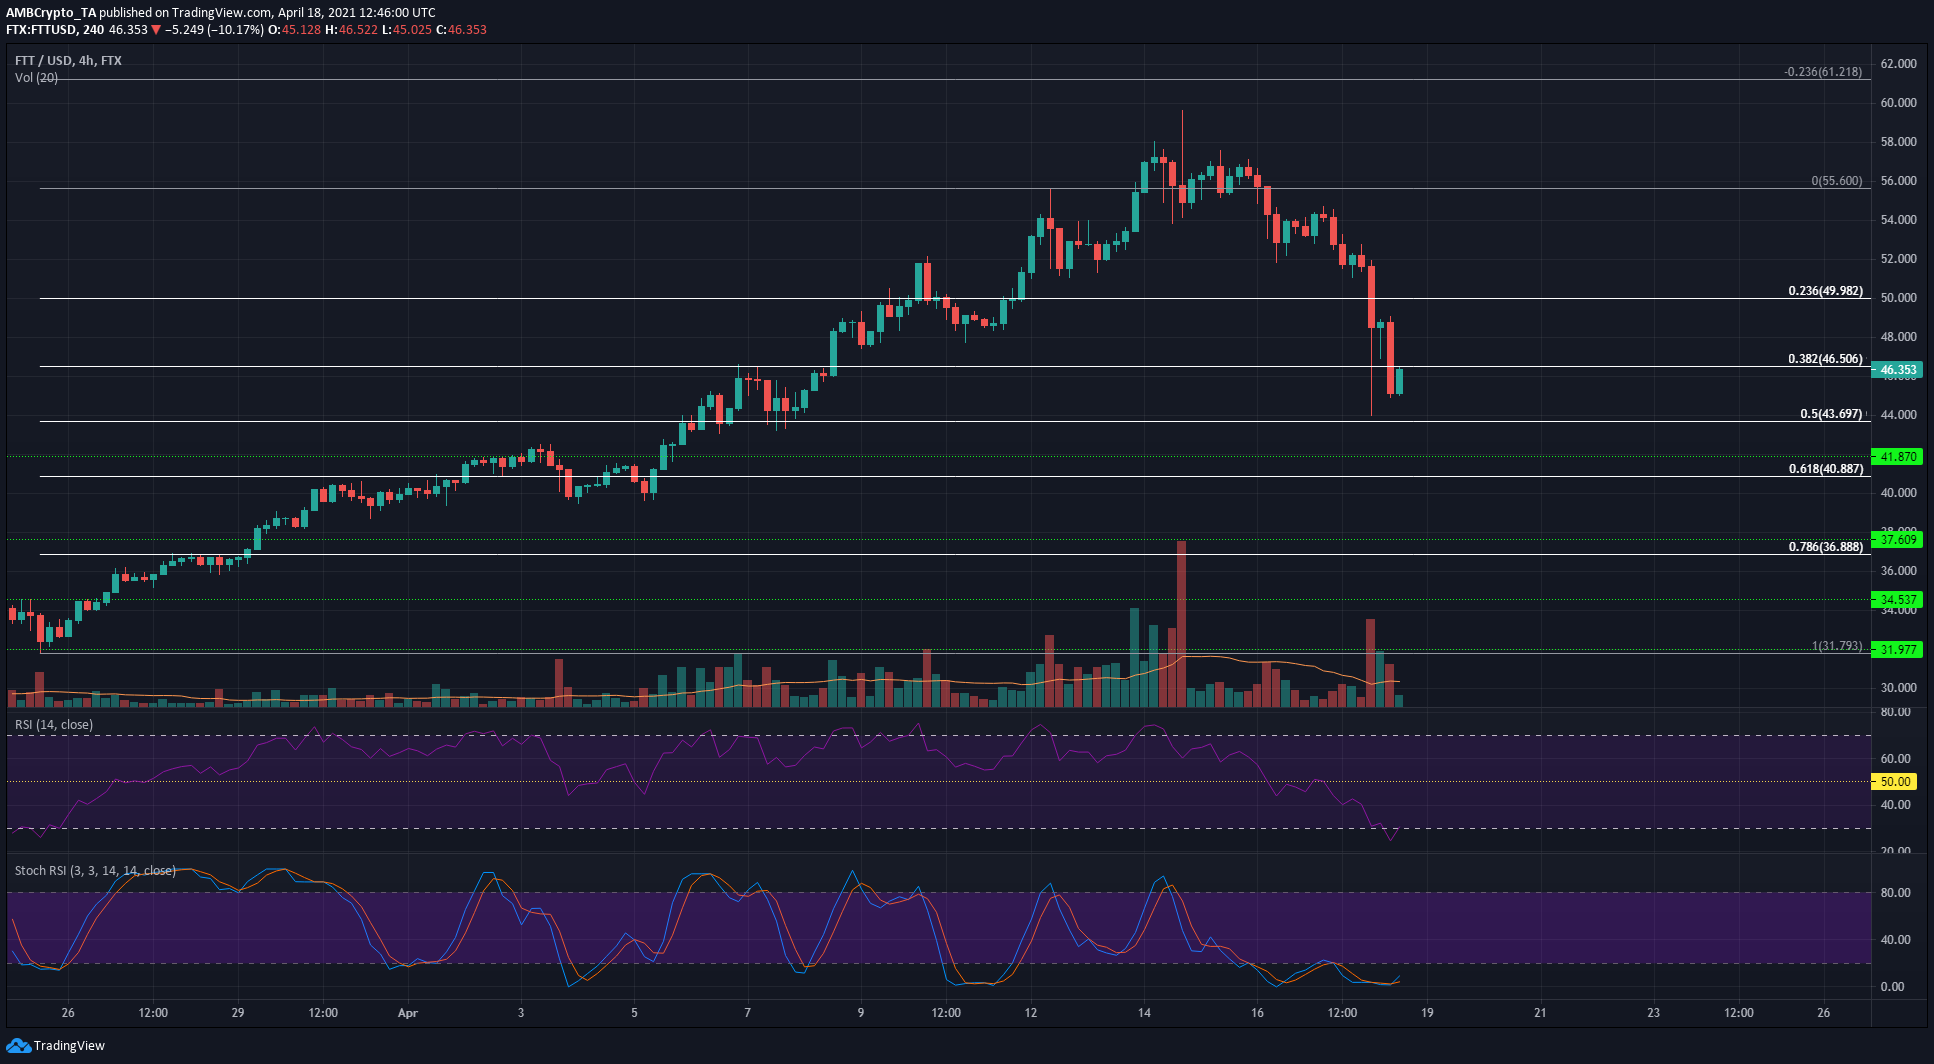
Source: FTT/USD on TradingView
FTT slipped beneath the 38.2% retracement level at $46.5 and could retest the $46.5-$47 area as resistance before another move down. The RSI and the Stochastic RSI were both in oversold territory, and a bounce could be seen.
Over the next few days, defense of the $43.7 or a climb back above $48 would be bullish developments, while closing a session beneath $43.7 could see FTT retrace further.
Waves [WAVES]
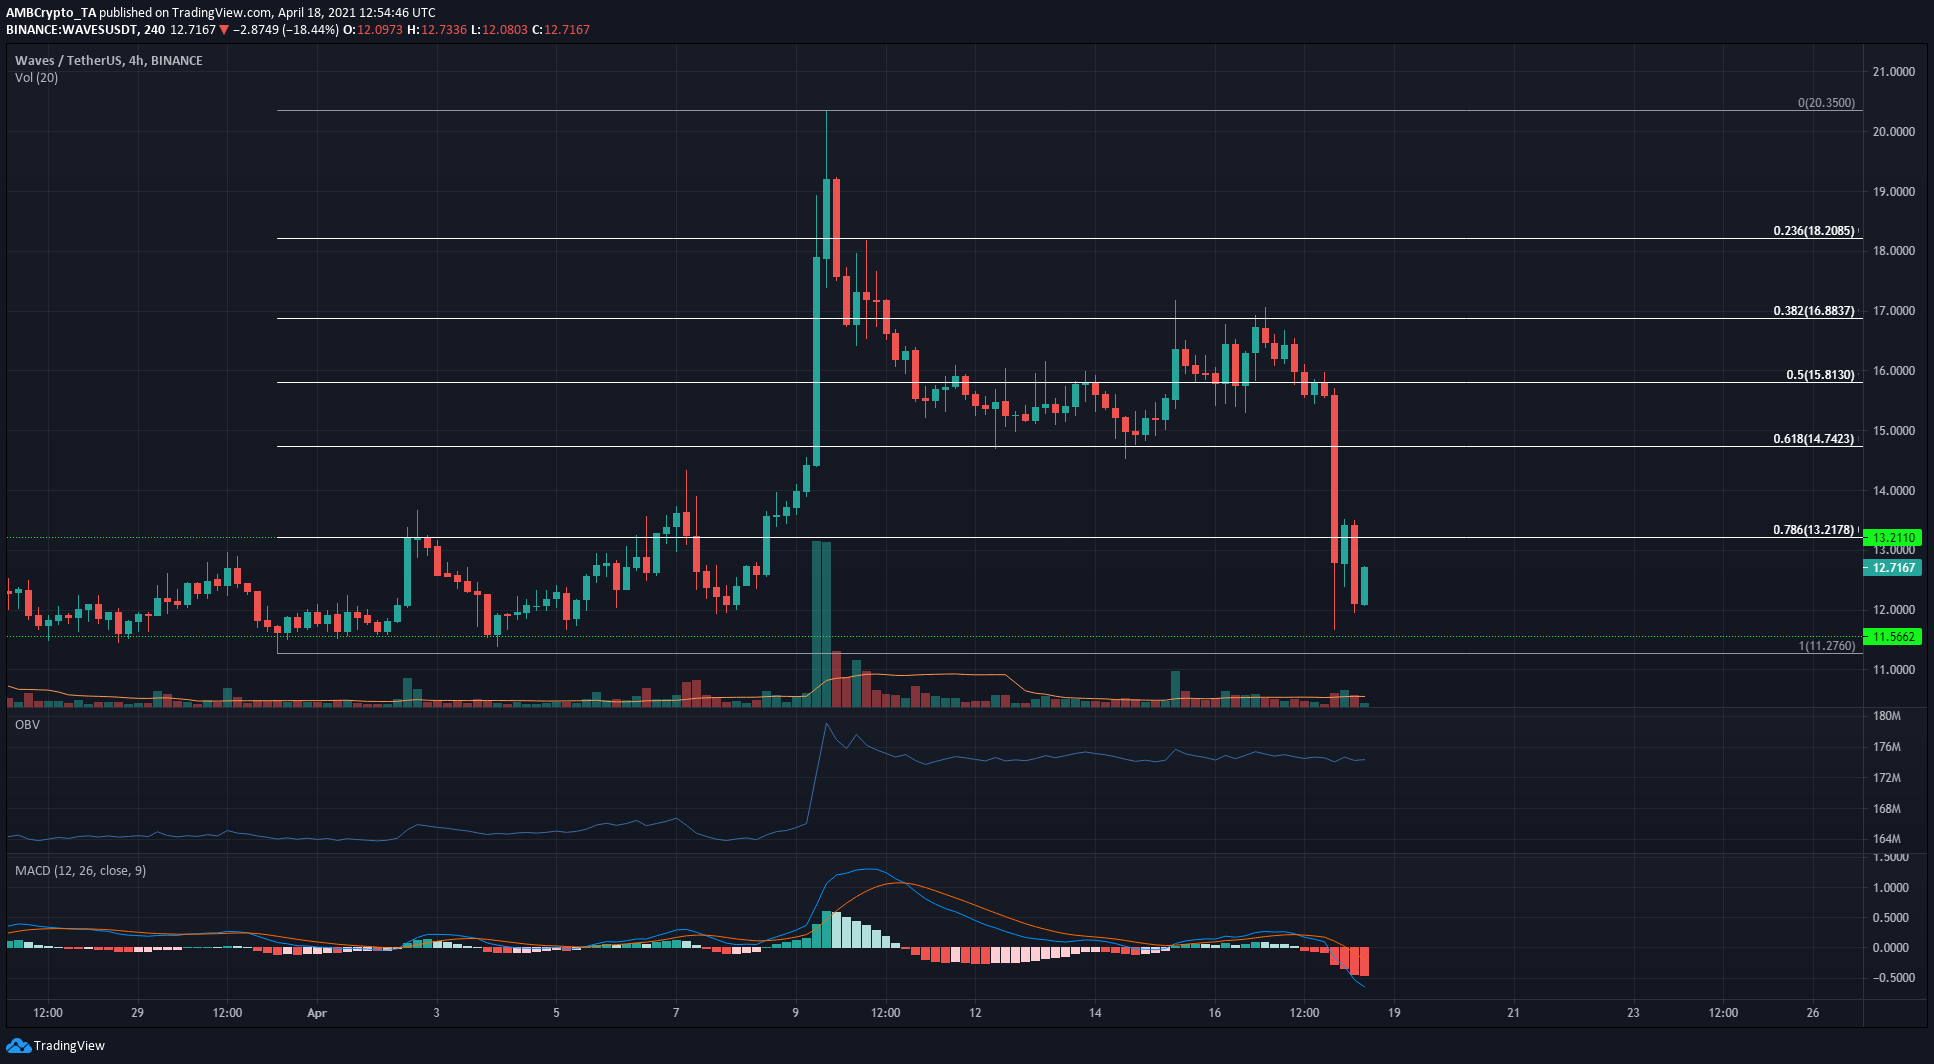
Source: WAVES/USDT on TradingView
While WAVES did indeed retrace almost as far south as $11.56, a support it had consolidated above in the last week of March, the OBV told a story of a lack of selling volume in comparison to the overwhelming buying seen back then.
The trading volume in the past few sessions was also barely above average, showing that while selling was seen, it did not rival the volume that backed Waves’ climb past $18.2. The MACD showed strong bearish momentum, but WAVES could see a similar consolidation above the $11.5 support before an attempt at recovery.