Stellar Lumens, Polkadot, Compound Price Analysis: 26 December

Some of the market’s large-cap altcoins had a bearish outlook to them. Stellar Lumens moved under the $0.156-level once more and could lose the $0.145-level of support as well. Compound indicated that it was likely to continue the bearish trend of the past few days, while Polkadot faced resistance from the $5.4-region of supply.
Stellar Lumens [XLM]
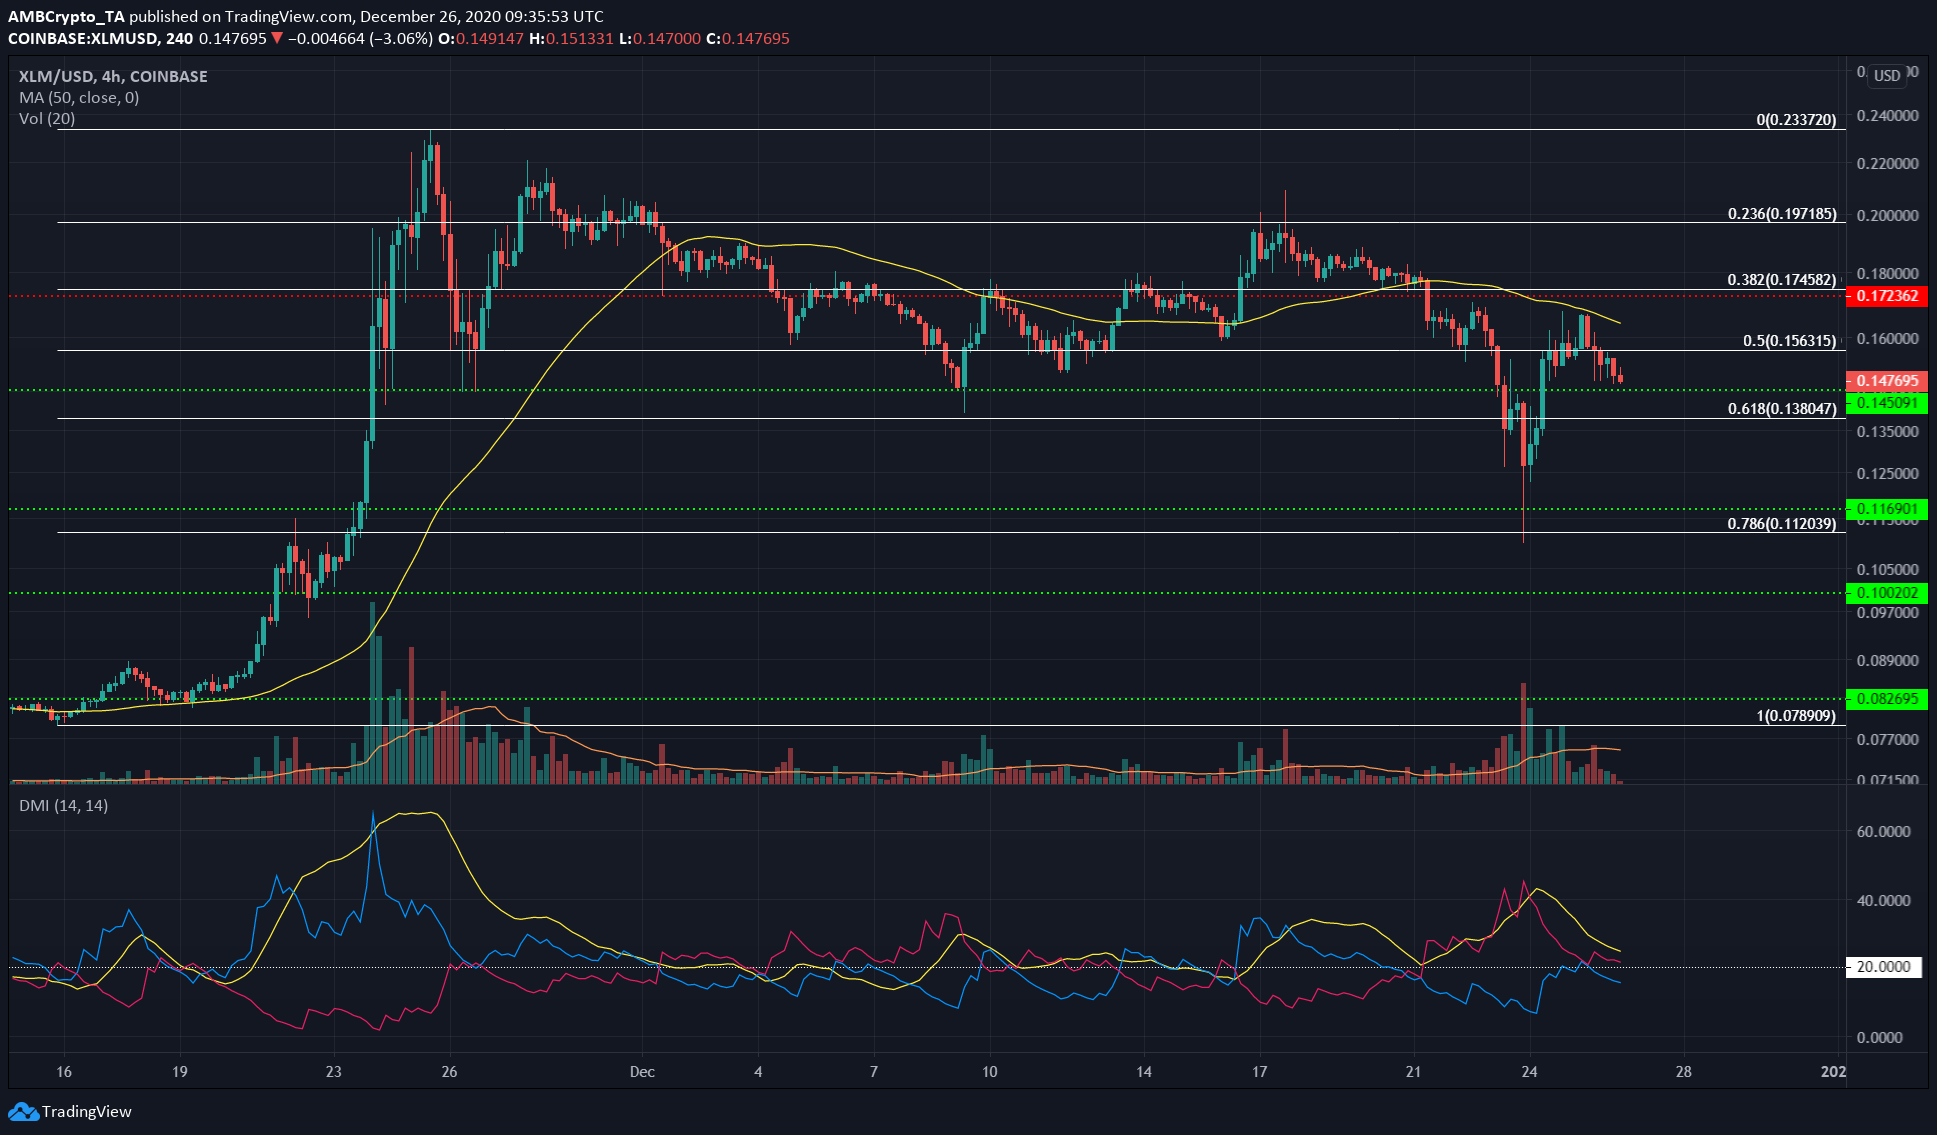
The Fibonacci retracement levels highlighted important support and resistance levels for XLM on its retracement from the local highs at $0.233.
The Directional Movement Index showed that a strong downtrend was in progress, although the ADX (yellow) was dropping towards 20.
The 50 SMA (yellow) acted as resistance to the price as it dipped below the 50% retracement level. This underlined a bearish short to medium-term outlook for XLM.
A session close beneath the $0.145-level would see XLM move towards the $0.116-level of support in the coming days.
Polkadot [DOT]
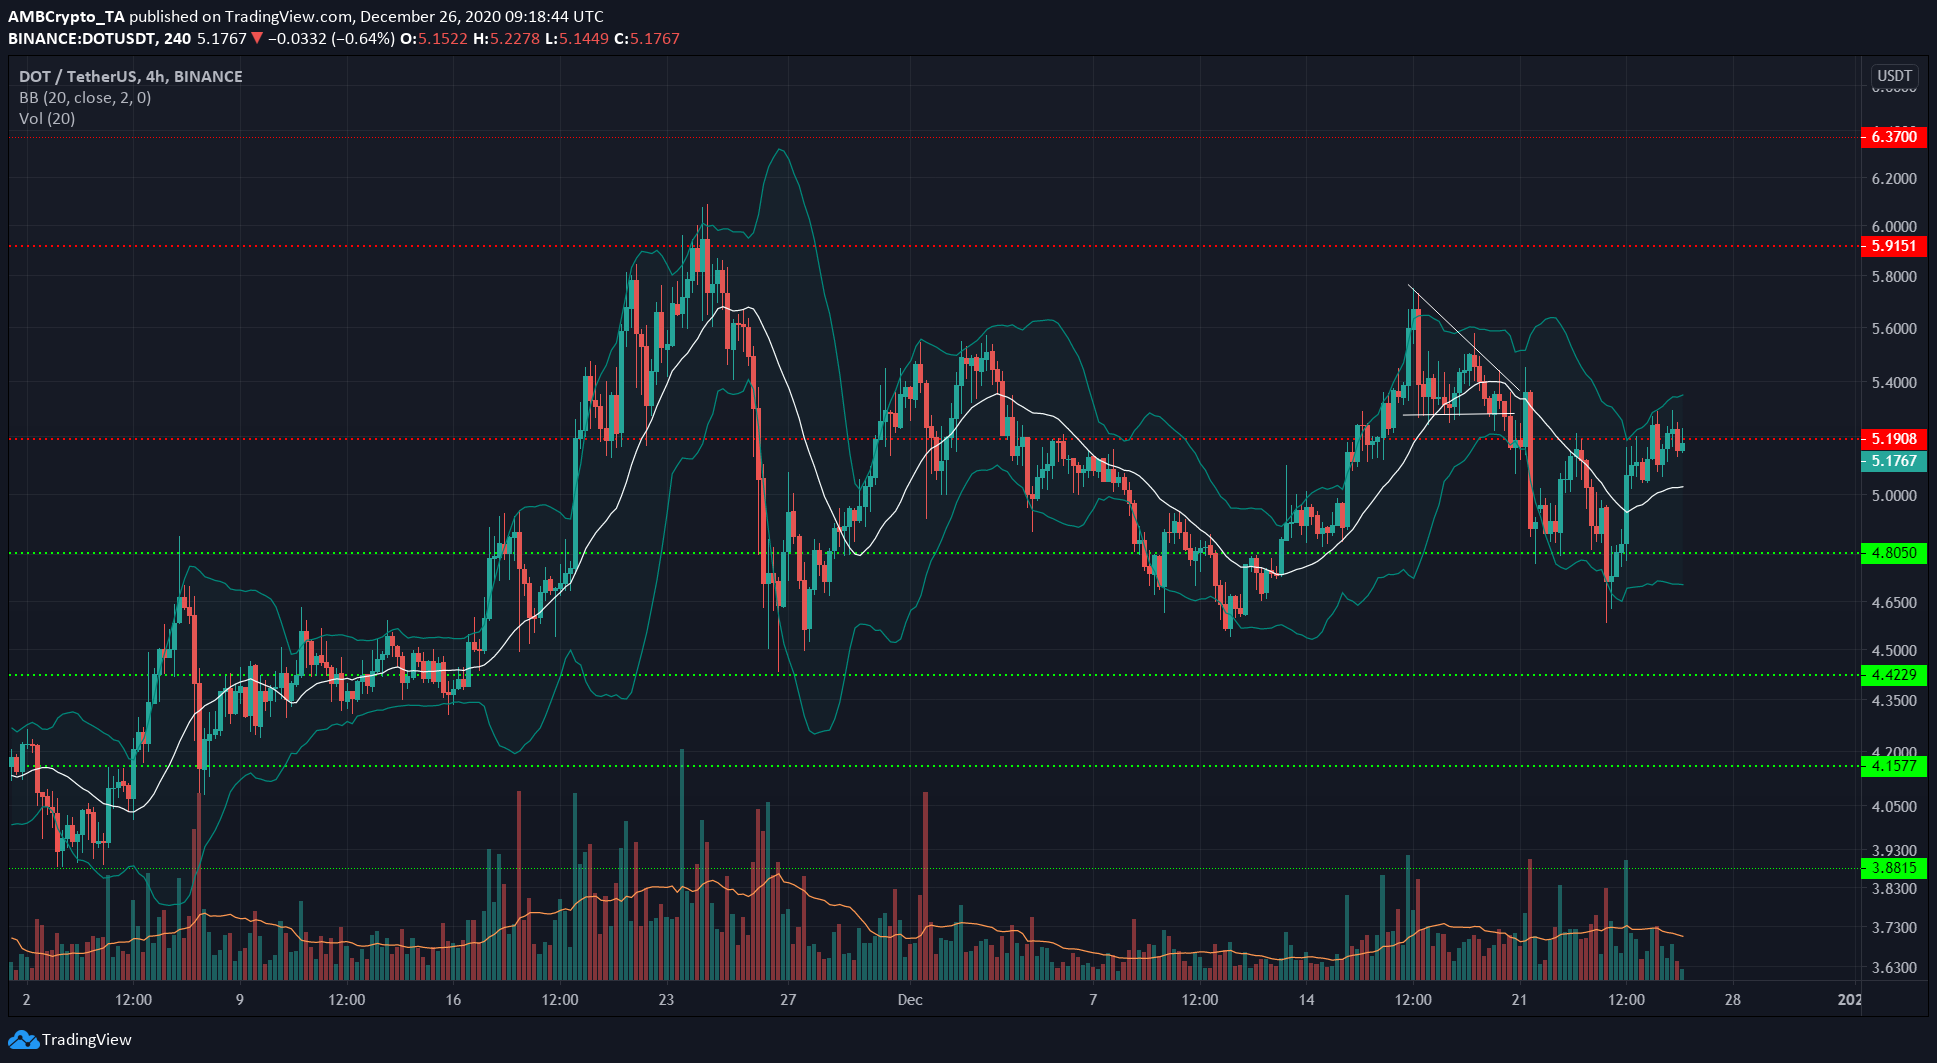
Predictably, the Bollinger bands were wide open around the price to indicate high volatility after it lost 10% of its value over the course of three days, then gained 12% of the same within 52 hours.
The past four weeks saw DOT consistently find a bottom at the $4.55-mark, while the $5.4-$5.6 region was an obstinate resistance.
The short-term momentum was on the bulls’ side as they sought to flip the $5.19-level to support once more. If successful, the aforementioned region in the vicinity of $5.5 would be the next notable region of supply.
Compound [COMP]
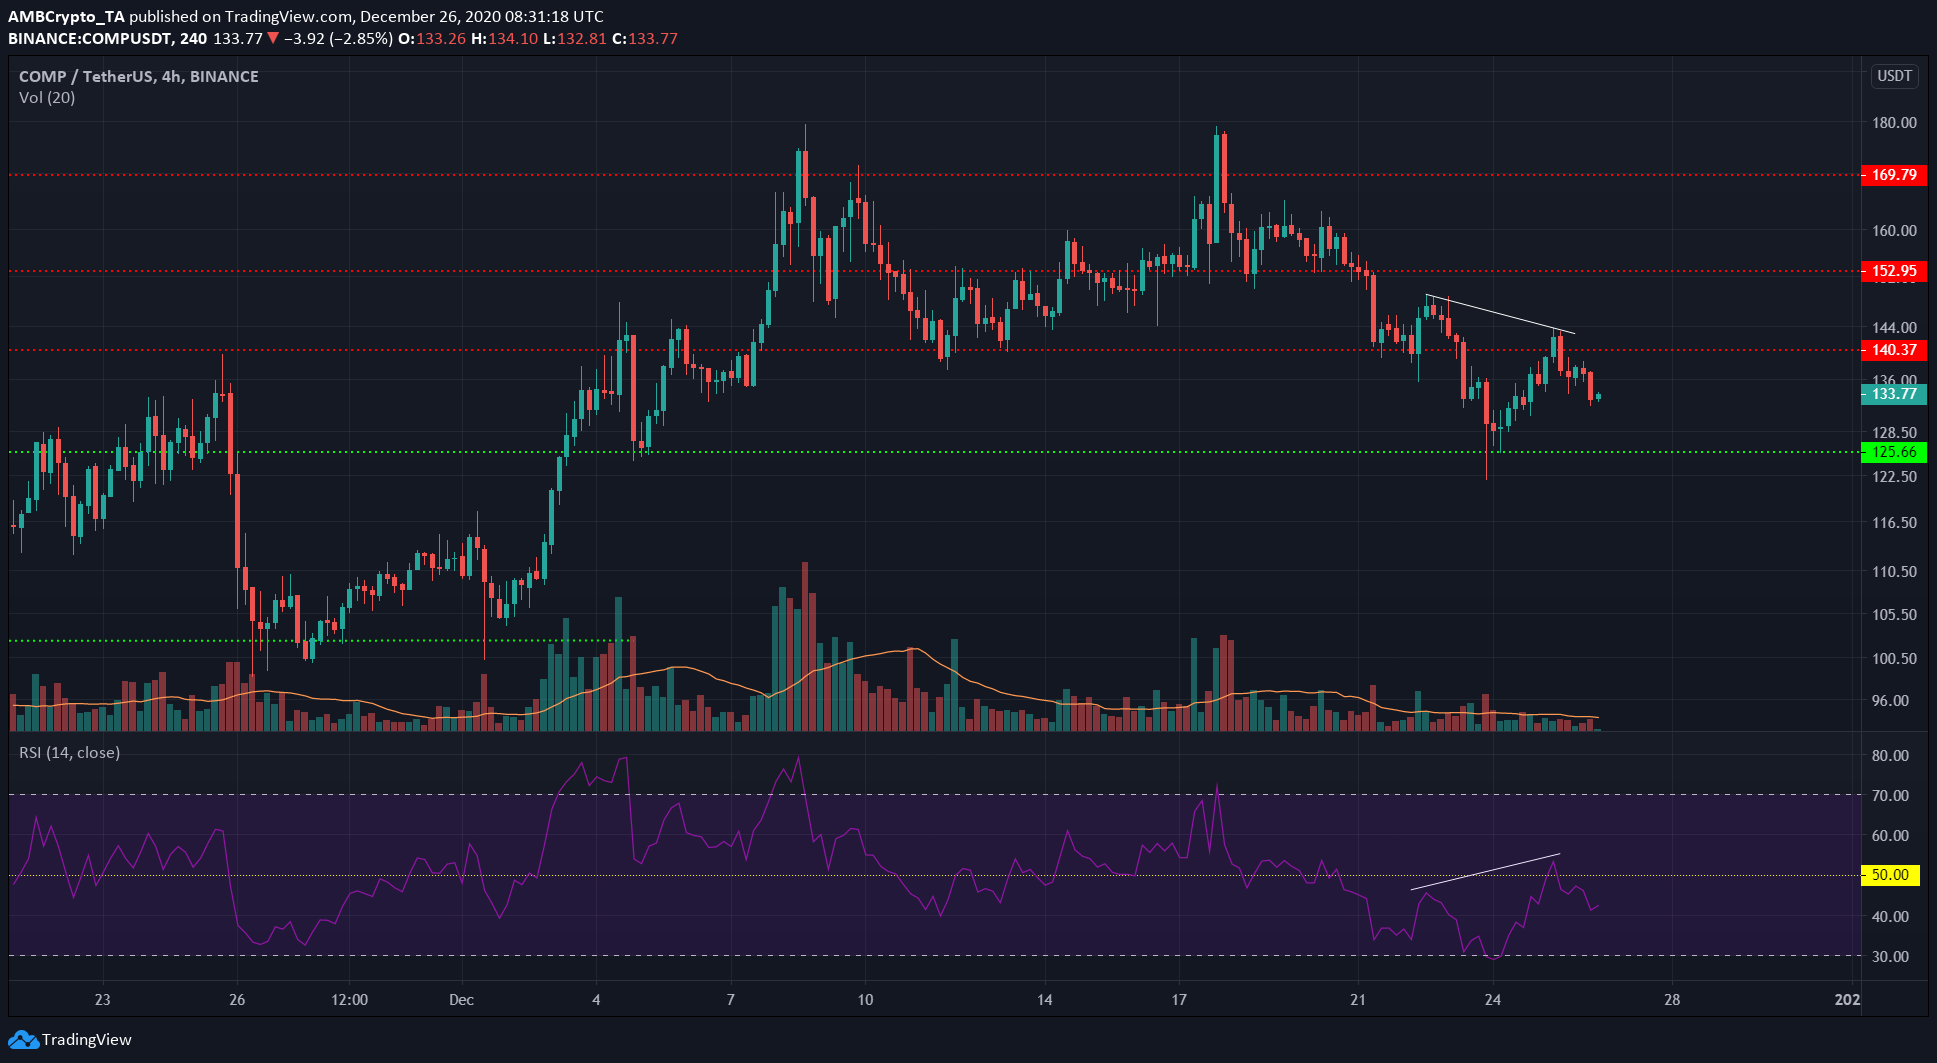
COMP registered a hidden bearish divergence between the price and the momentum indicator (RSI). This signaled the continuation of the trend, one which was bearish for COMP after the past week saw it rejected at the $175-mark, following which, it came under a lot of selling pressure.
It lost the levels at $152 and $140 to the bears as well on its steep descent and could be set to see further downside on the charts. It enjoyed a level of support at $125 too.