Tezos: How XTZ traders can leverage this pattern’s break to remain profitable

Tezos (XTZ) has been on a constant plunge since its all-time high in 2021, while finding fresher multi-monthly lows. Over the past three weeks, the alt has been hovering in the $1.2-$1.6 range. With the recently increased buying pressure, XTZ saw an up-channel (white) oscillation in the four-hour timeframe.
Looking at the recent rejection of higher prices in the $1.5-region, the alt could see near-term setbacks. At press time, XTZ traded at $1.517, up by nearly 3% in the last 24 hours.
XTZ 4-hour Chart
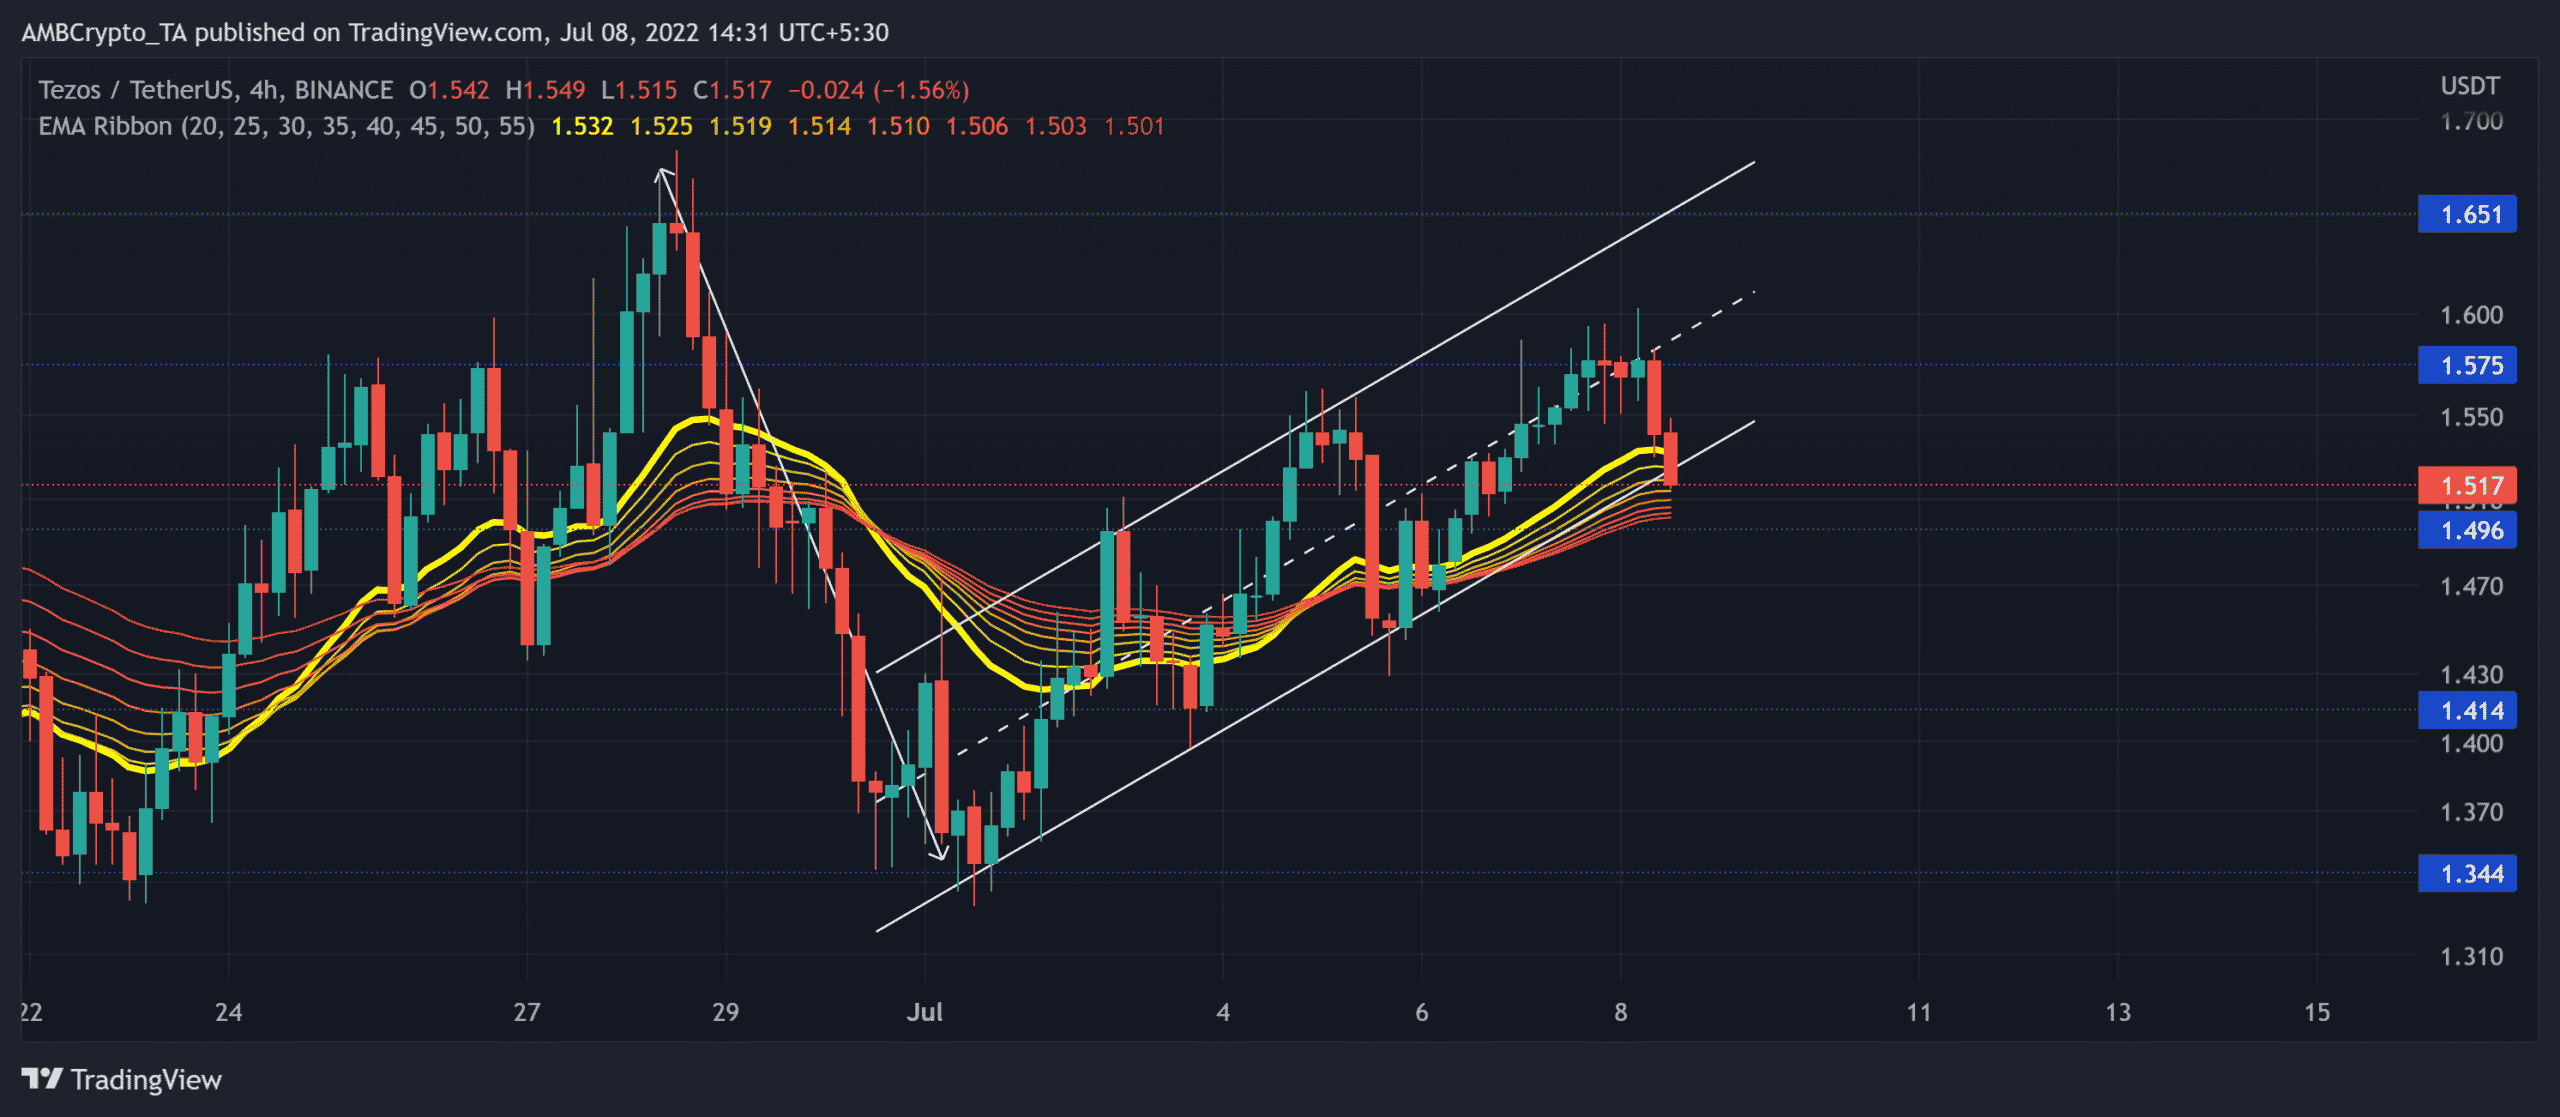
The previous bearish pull from the $2.2-mark saw a nearly 50% retracement as it snapped through numerous vital price levels. Thus, pushing the price action below the EMA ribbons.
However, the bulls have shown a gradual resurgence from the alt’s 27-month low on 19 June. This revival stemmed from many factors, one of them being the willingness of the buyers to uphold the two-year-long support in the $1.2-zone.
Over the last few days, XTZ saw an up-channel that helped buyers reclaim a spot above the EMA ribbons.
As the price approaches the lower trendline of the up-channel, the sellers could try to look for a breakdown. In this case, the potential shorting targets would lie in the $1.414-mark. However, a continued bullish rally should find testing resistance near the $1.5-$1.6 range.
Rationale

The Relative Strength Index (RSI) finally found a place above the midline but still revealed a neutral stance at press time. From here on, a potential revival from the midline could help the buyers continue the patterned oscillation on the chart. But a fall below this level could hint at a shift in momentum.
Also, the Directional Movement Index (DMI) flashed a bullish bias. The lines still needed to observe a bearish crossover to make way for a strong breakdown. However, the Moving Average Convergence Divergence (MACD) lines saw a bearish crossover and affirmed ease in buying pressure.
Conclusion
XTZ could eye at a near-term downside if the bears breach the up channel’s lower trendline. The targets would remain the same as above. A potential buying resurgence could continue to find resistance near the $1.5-$1.6 range.
However, Bitcoin’s movement and the overall market sentiment need to be factored in as a complementary tool to make an accurate decision.


