Tezos, IOTA, Compound Price Analysis: 23 September

Tezos secured double-digit gains as the coin rallied over the last 24 hours and approached its one-week high. IOTA appreciated by 6.3% and broke above its immediate support line. Finally, Compound gained by 5.1% despite its buying pressure struggling to revive itself.
Tezos [XTZ]
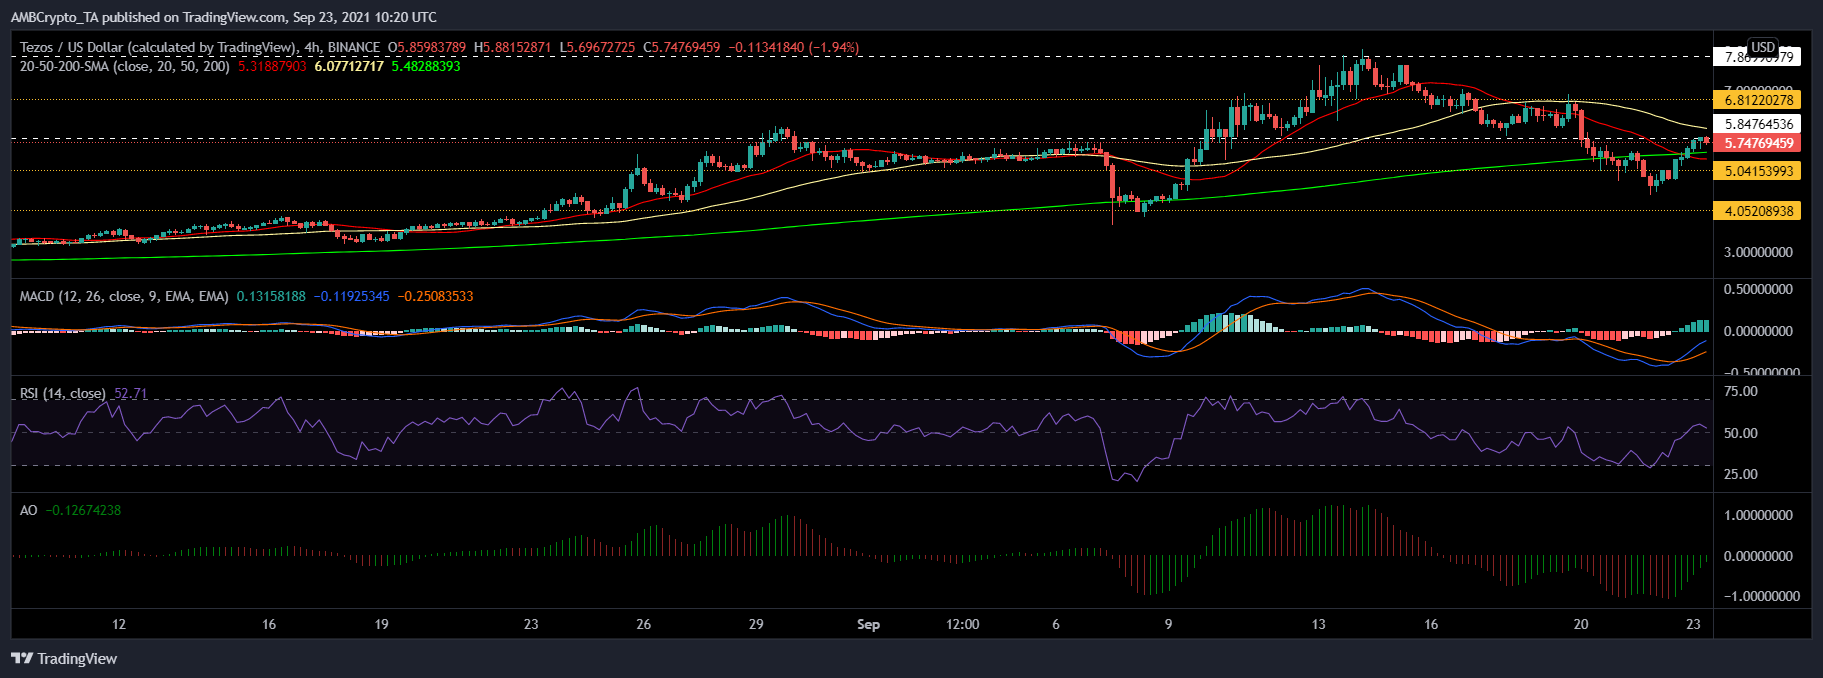
Tezos rallied by 15.7% over the last 24 hours and was trading at $5.74. It could topple its immediate resistance of $5.84 over the upcoming trading sessions and trade near its one-week high of $6.81.
Parameters for Tezos pointed to bullish price action on the charts. On the four-hour chart, the altcoin’s price stood over the 20-SMA line. This meant that price momentum was with the market’s buyers.
The Relative Strength Index was seen above the half-line. MACD underwent a bullish crossover and displayed green histograms. Awesome Oscillator noted green signal bars.
A pullback in the price would result in XTZ trading near its nearest support of $5.04 and then at $4.05.
IOTA
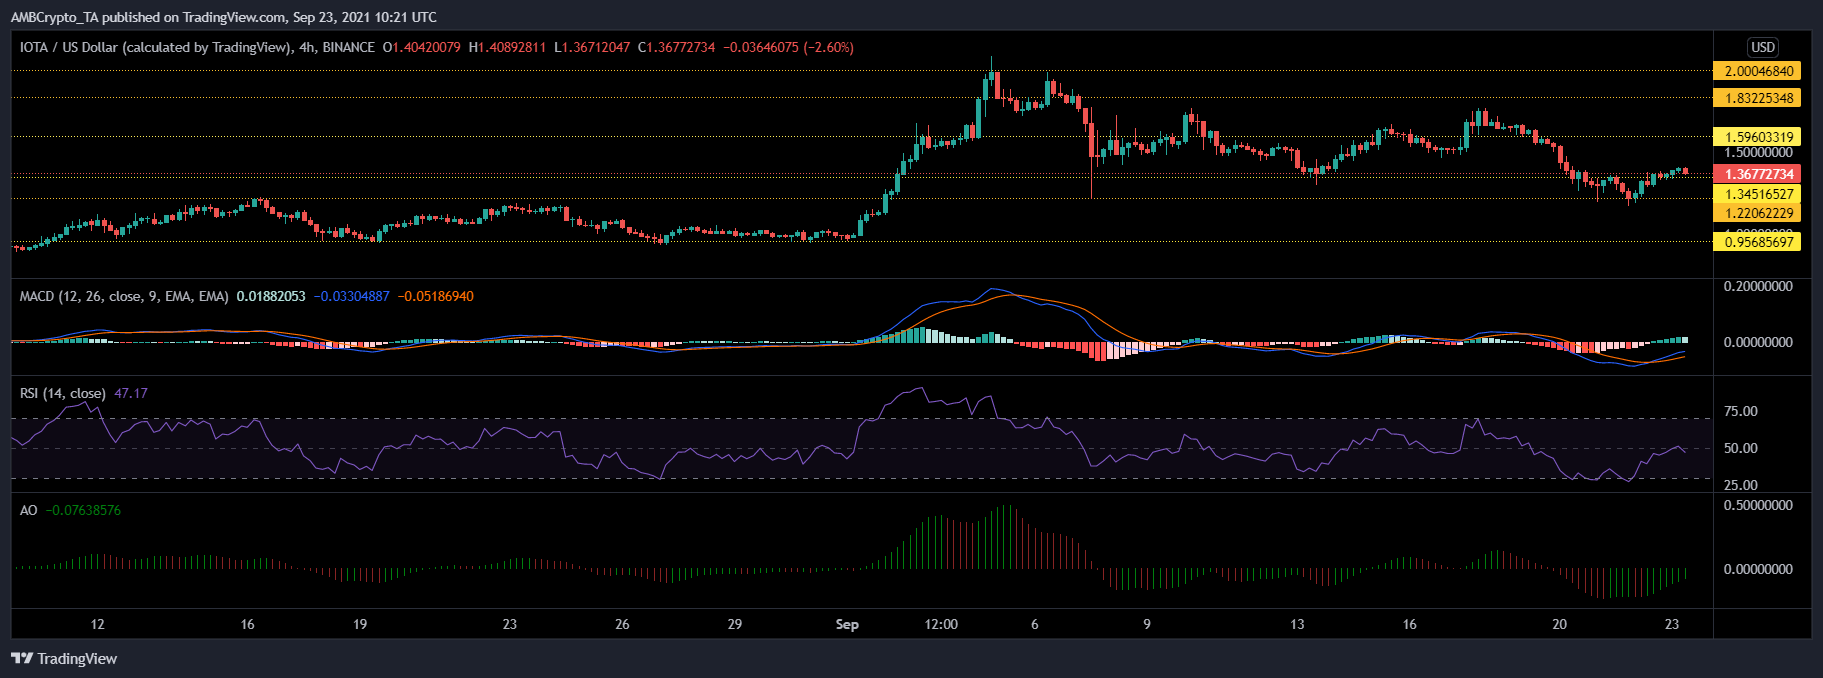
IOTA was up by 6.3% over the last 24 hours and was valued at $1.36. At press time, it had just toppled its support line of $1.34. On maintaining a steady recovery, IOTA could revisit the $1.59-level and then trade near $1.83. The technical outlook seemed to be positive.
MACD witnessed a bullish crossover and flashed green histograms. Awesome Oscillator displayed green signal bars. On the contrary, the Relative Strength Index was below 50 – A sign of a drop in buying strength.
A sustained drop in buying strength would drag the price down to $1.22 and then onto the alt’s three-week low of $0.95.
Compound [COMP]
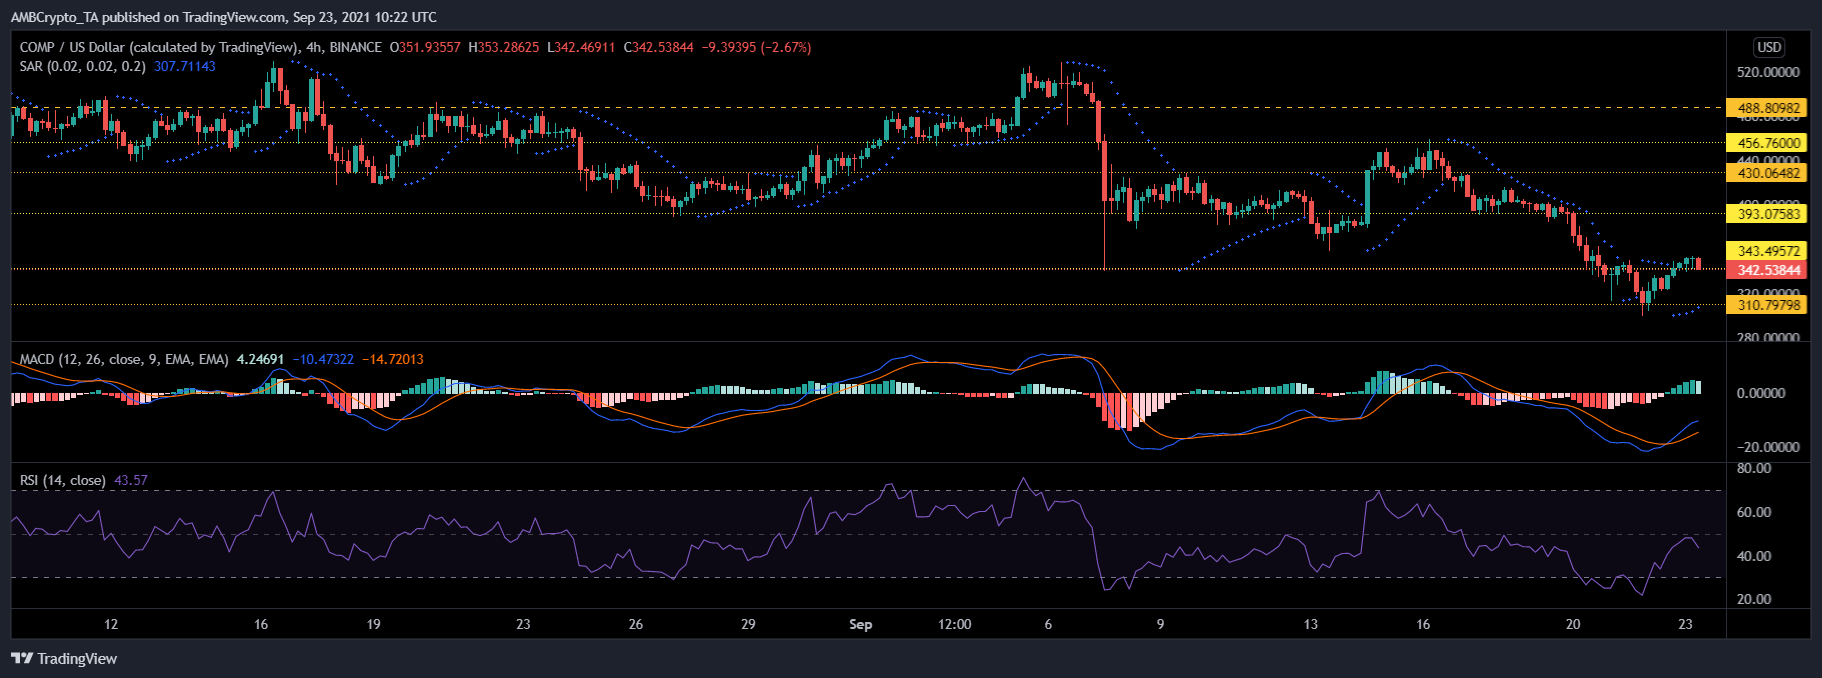
Compound recovered by 5.1% over the last 24 hours. An overhead resistance awaited the crypto at $343.49. The other additional resistance levels stood at $393.07, $430.06, and then at Compound’s one-week high of $456.76.
Key indicators implied bullish price action owing to the crypto’s recovery.
The Parabolic SAR aligned the dotted lines under the price candlesticks – A reading that meant the price was on the rise. The MACD also depicted bullishness through the green histograms. Buying strength, conversely, still remained bearish as the Relative Strength Index was below the half-line.
If selling pressure continues to exert dominance, the price can fall again. The nearest support for Compound was at $310.79


