Tezos, NEM, IOTA Price Analysis: 03 August

Bitcoin tanked once more, falling to $38,692 as it experienced resistance at $42,000. Altcoins walked the same path and failed to hold prices beyond their resistance levels. Tezos had made minor gains but the bears took over at the time of writing. XEM’s attempt to test its immediate resistance was halted as the it fell by 4.6%. MIOTA was likely to fall below its current support level.
Tezos (XTZ)

The price of XTZ was $3.07 at press time. It noted a minor gain over the last 24 hours amidst market volatility. However, Bollinger Bands displayed some convergence, which meant that volatility could decrease over upcoming trading sessions.
XTZ tested its $3.08 resistance level, above which the coin could not surge, since the beginning of July. The recent dip caused the coin to push below it. Relative Strength Index still flashed signs of strength as it stood above the 50-mark despite a dip in buying pressure.
A bearish signal was seen on the Awesome Oscillator implying the presence of the same. In the event of a dip below the current price level, XTZ may end up on the $2.77 price floor and then subsequently at $2.58. On the upside, however, the next possible resistance level, lay at $3.27.
NEM (XEM)
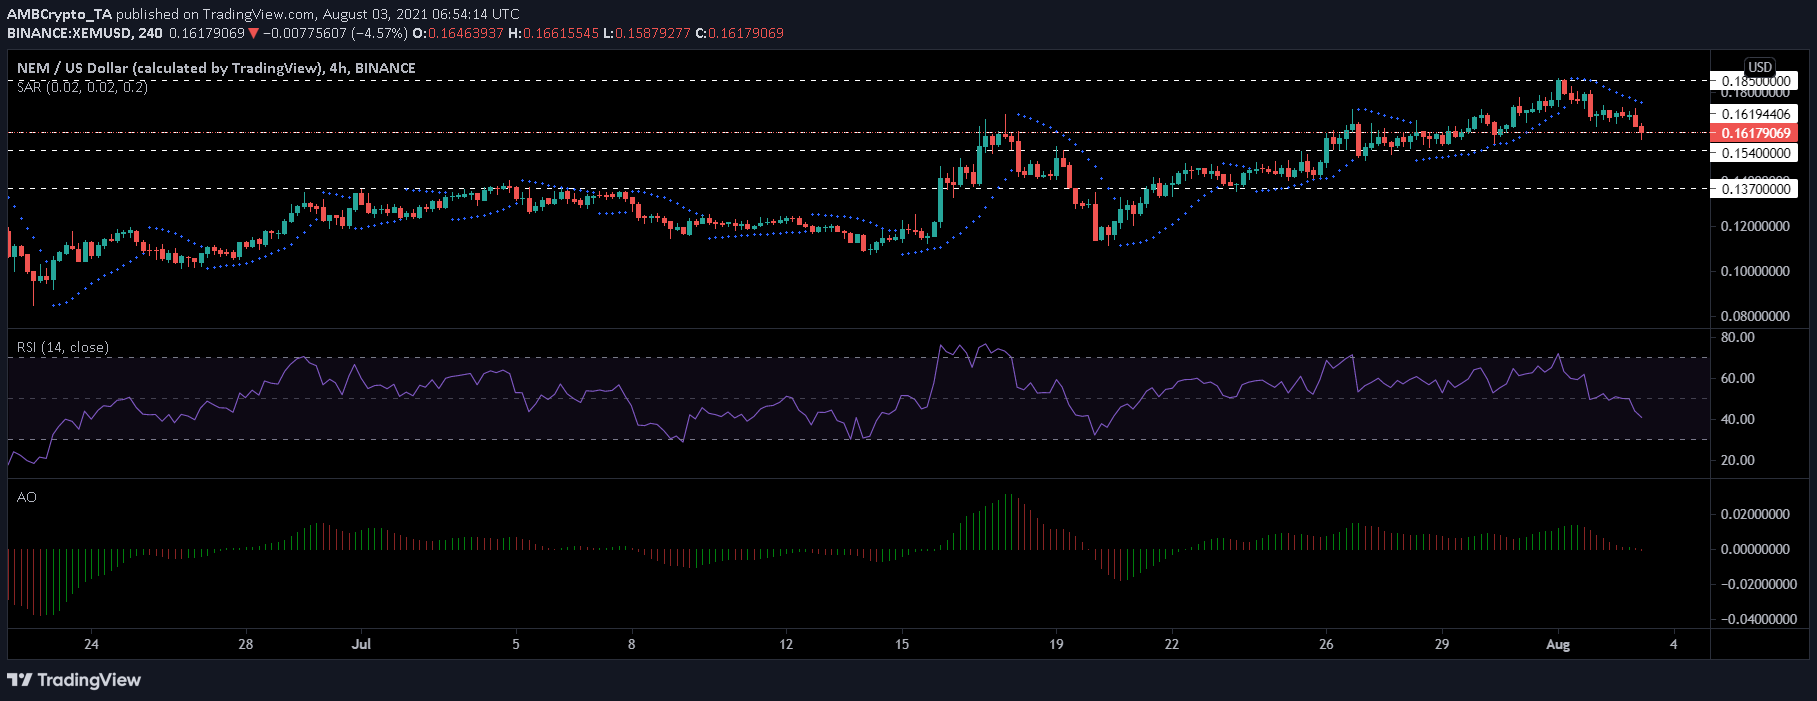
XEM token’s uptrend has been steady ever since July 21, as it struck out many resistance levels one after the other. It was almost about to break through the $0.185 resistance level.
However, but the recent plunge in prices landed the token on the $0.161 support level. At press time, the coin was priced at $0.161 as it noted a 4.6% decline.
The Parabolic SAR validated the downtrend as the dotted lines aligned themselves above the candlesticks. With a continued downtrend, the support region remained at $0.154 and subsequently at $0.137 respectively, in case of a dip.
The bulls had stayed intact on the Realtive Strength Index since July 19, however, at press time, the indicator broke support and plummeted into the bearish territory. Red signal bars were noticed on the Awesome Oscillator which flashed potential signs of gaining momentum.
IOTA (MIOTA)
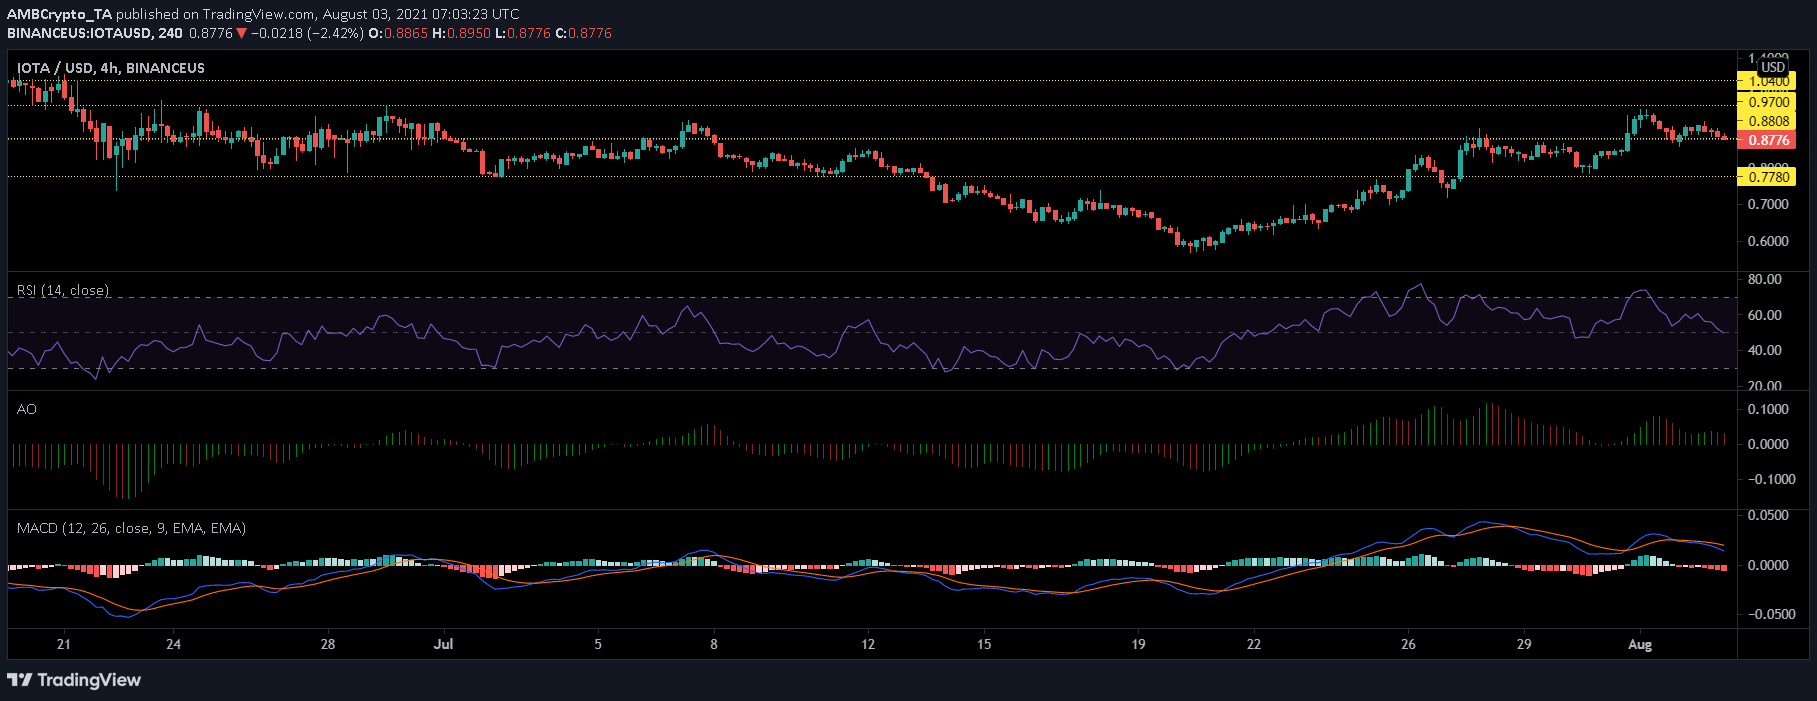
MIOTA lost 2.4% overnight as it approached its support level of $0.877. The bears could exert further pressure looking at the technical indicators, in case of which, MIOTA could soon reach the price floor of $0.778.
The Relative Strength Index, just a few days ago touched the overbought zone and at press time, fell to its midline. This decrease in buying pressure was substantiated with red signal bars seen on the Awesome Oscillator.
MACD too showed growing red histograms at press time. In case of a price reversal, MIOTA will face resistance again at $0.97.


