Polkadot, Tezos, Ethereum Classic Price Analysis: 01 August

The cryptocurrency market was trading in the green on August 1 with a 3% increase in market capitalization. Altcoins also displayed positive developments. Polkadot gained 13.2% and looked ready to test its immediate resistance. Tezos and Ethereum Classic, despite smaller gains, presented a bullish outlook on their technical charts.
Polkadot (DOT)
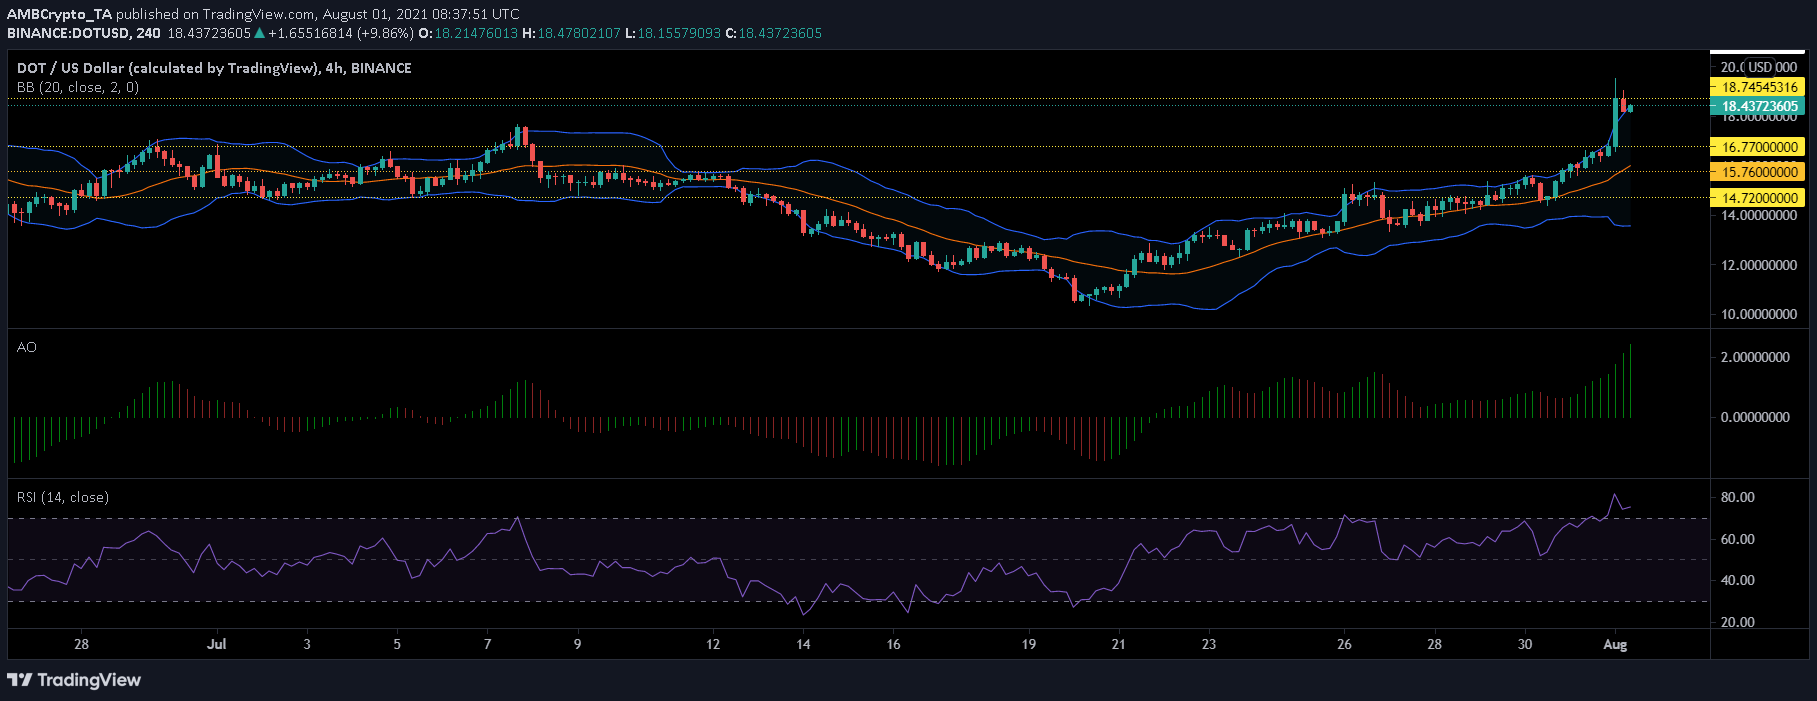
DOT registered a staggering 13.2% gain overnight as prices rallied owing to broader market stability. At press time, DOT stood at $18.43. A slight push from the bulls would have the token test its resistance level of $18.74. In case prices retrace, the support region for DOT can be marked at $16.77 and then at $15.76.
Market volatility remained high as Bollinger Bands opened up, indicating chances of price fluctuations. Other technical indicators flashed positive signs too.
The Relative Strength Index was seen above the 70-mark. It recorded a tiny downtick at press time, as buying pressure declined slightly. Green signal bars grew in size and strength on the Awesome Oscillator verifying the bullish force in the market.
Tezos (XTZ)
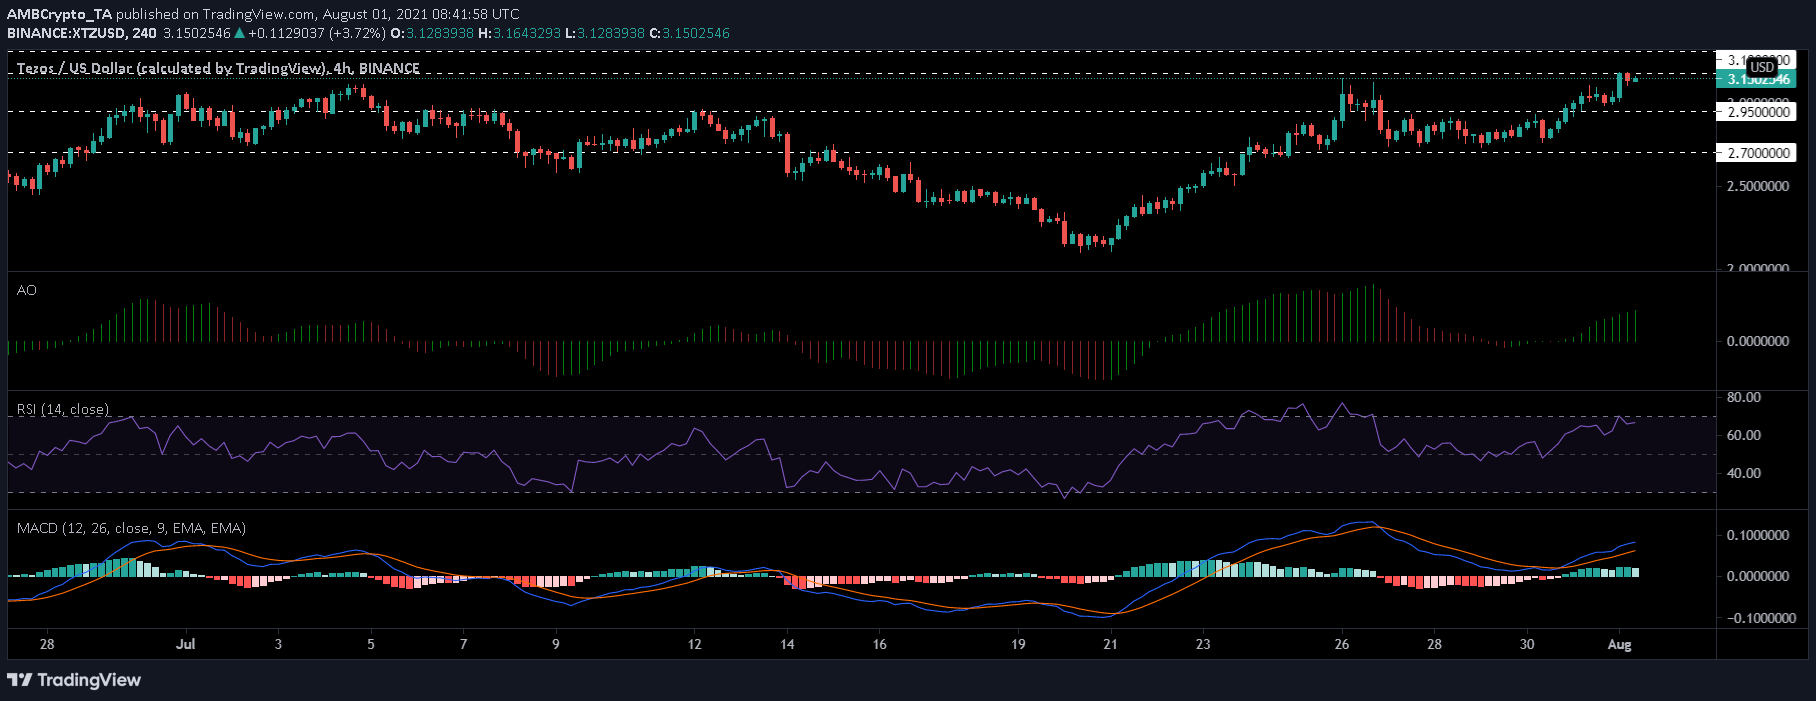
XTZ depicted steady growth since July 21, as it tested its resistance levels one after the other over the last two weeks. In a week, XTZ hiked by 13.4%, however, overnight the coin recorded a minor increase of 1.8%. At press time, the asset was valued at $3.13.
The immediate resistance for XTZ to test was $3.31. With a continued bullish momentum, the asset could trade above it. On failing to test this level though, it might fall and rest on $2.95 and subsequently at $2.70.
On the 4-hour charts, Awesome Oscillator showed the strength of the green signal bars and an increase in buying pressure. The Relative Strength Index substantiated the same by noting an uptick. MACD indicator noted a bullish crossover and presence of green histograms at press time.
Ethereum Classic (ETC)
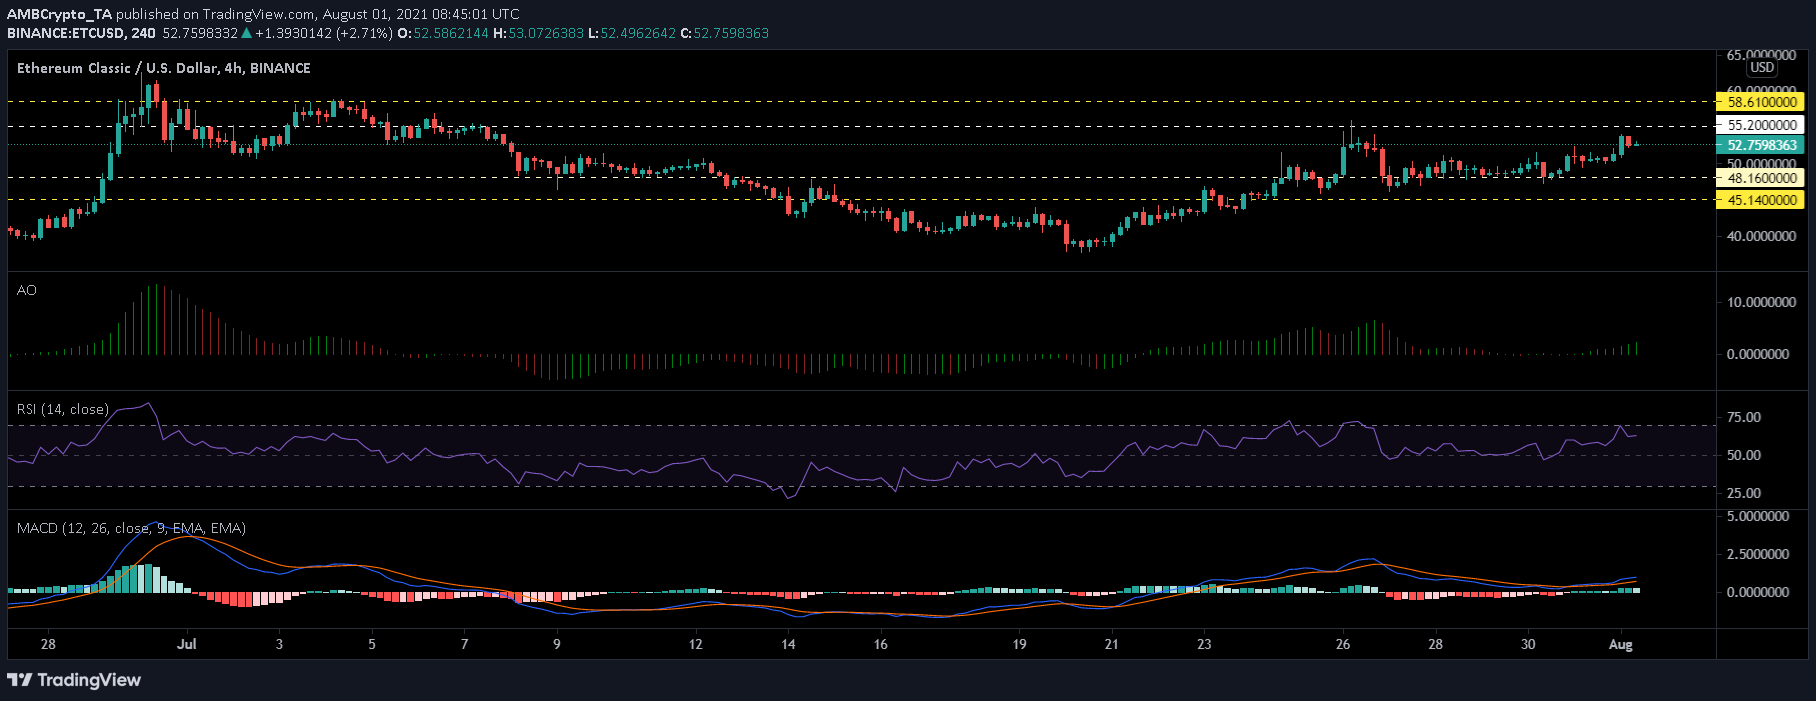
ETC, despite noting sideways movement, displayed considerable recovery from its $48.16 support region. At press time, it was available for $52.75. Further, it could test the $55.20 immediate resistance with broader market support. In the last 24 hours, ETC accounted for a 3.5% gain.
In case ETC fails to test its $55.20, chances are that the token might again fall to the support region of $48.16, however, the as the technical charts indicated, prices might see further hikes. The Awesome Oscillator showed a growing bullish signal.
MACD flashed green bars signifying the build-up of bullish momentum. Relative Strength Index remained in the bullish territory too, above 60, complemented by a minor uptick at press time.


