Tezos Price Analysis: 11 February

Disclaimer: The findings of the following analysis are the sole opinions of the writer and should not be taken as investment advice
Tezos has been trading within an ascending channel since it broke out beyond the $2.4-level of resistance and flipped it to support. Over the last few days, XTZ has registered strong gains to defend the $3-region, with the crypto seeing a lot of demand accompany its rapid ascent to $4.19.
Tezos 1-hour chart
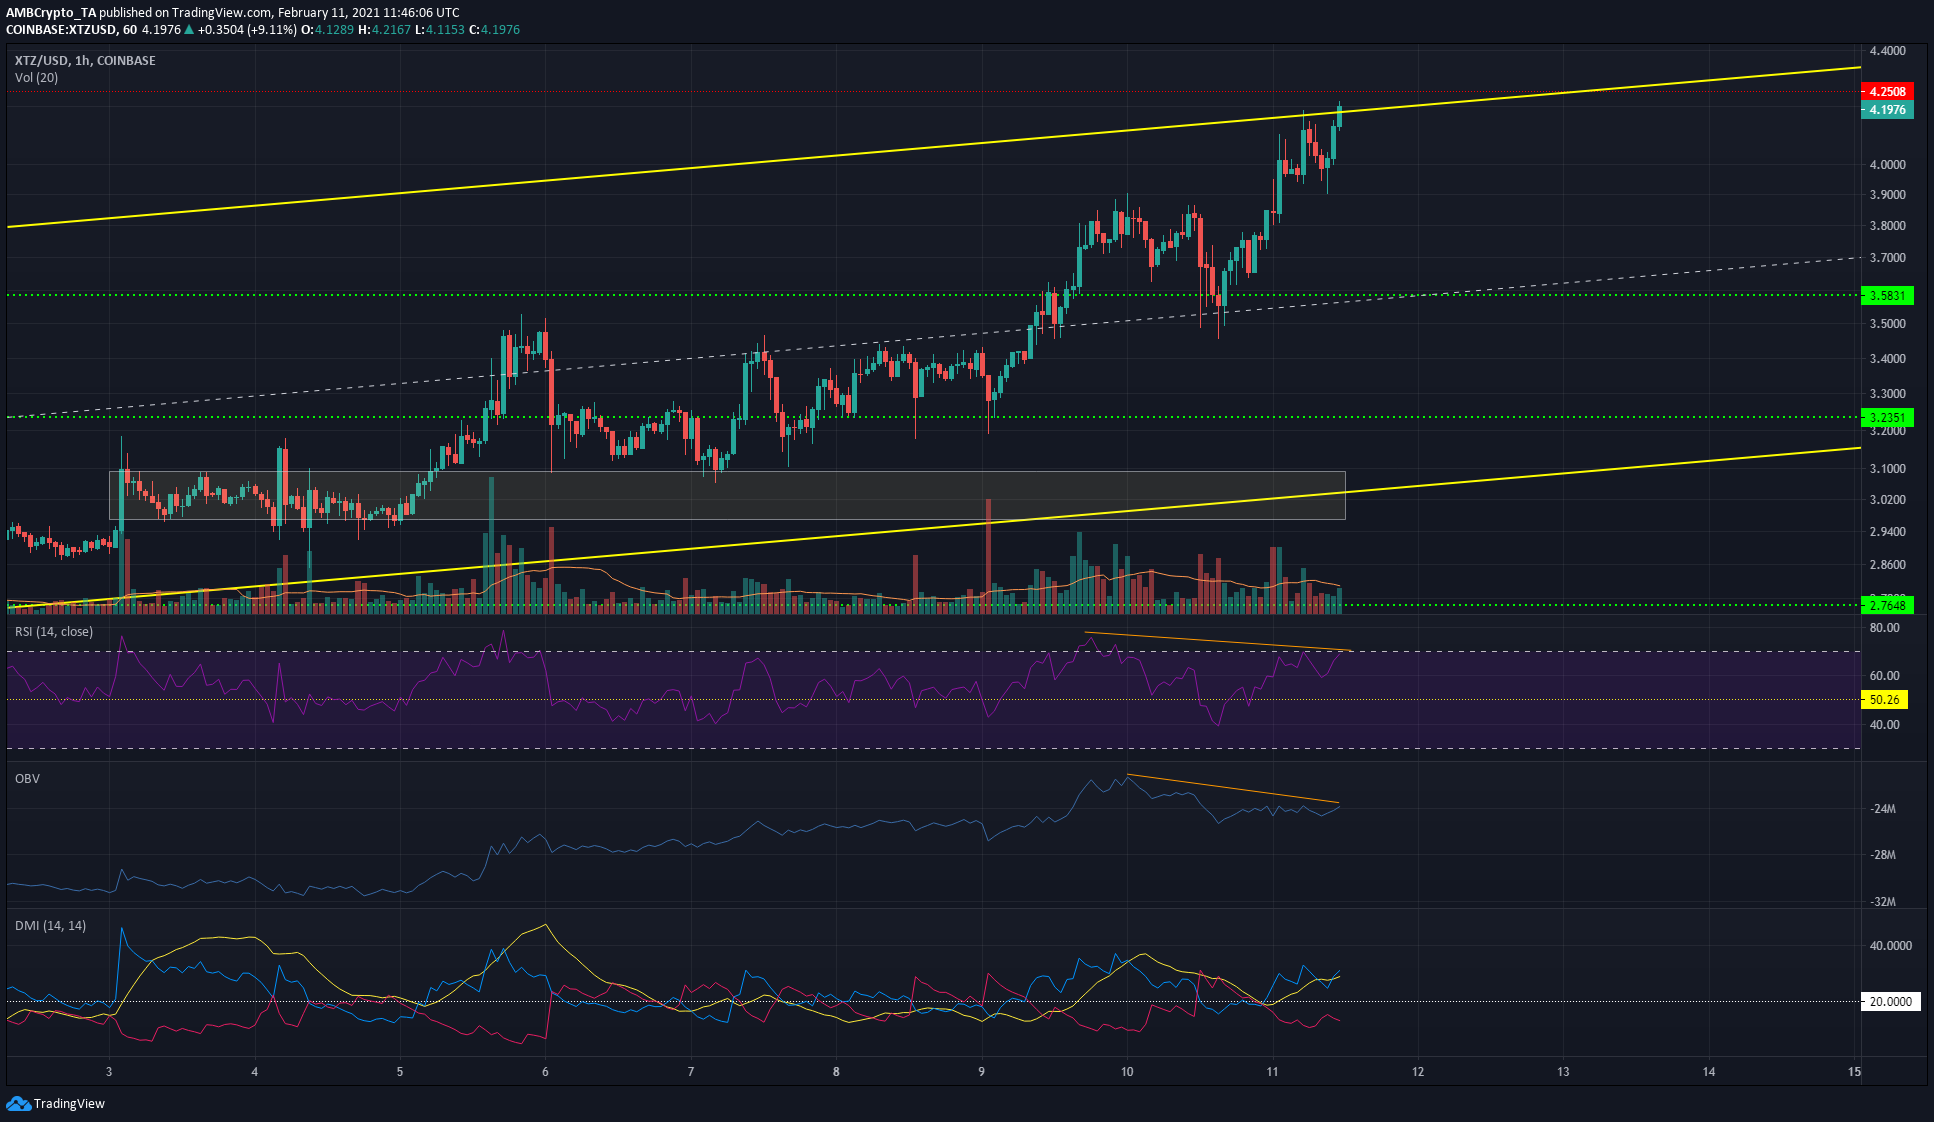
A week ago, the lower boundary of the rising channel looked like it would face some pressure from the bears if the $3-level did not see buyers step into the market. However, the bulls have risen to the challenge.
Not only was the highlighted region defended, but flipped into one of demand as XTZ rose swiftly. It also flipped the dynamic mid-point of the range to support, as well as the $3.58-level.
At the time of writing, it was trading just under the channel’s upper boundary, with resistance at $4.25 just beyond. In the short-term, the possibility of a pullback was observed too.
Rationale
Although the Directional Movement Index showed that a strong uptrend was in progress with the ADX (yellow) above 20, there were some bearish divergences in the shorter timeframe.
The OBV and RSI made lower highs even as the price made a higher high. This was an indication of disagreement and could result in a pullback at the channel boundary. A Doji or hammer reversal candle would point to an imminent dip.
However, momentum on the longer timeframes continued to be strongly bullish due to XTZ’s recent performances. Hence, a pullback to $3.8 would likely be an opportunity to buy. Further, a reversal in the uptrend was not seen on the charts either.
Conclusion
At the time of writing, the Tezos market was making a decision about the next direction of the market. A rejection at $4.2 over the next few hours would see a pullback to $3.8, and possibly as far south as $3.6, if the bears are strong enough. Unless the $3.6-level is lost, the long-term trend can be considered bullish.


