Tezos: What to expect from XTZ’s recent patterned breakdown

Disclaimer: The findings of the following analysis are the sole opinions of the writer and should not be considered investment advice.
Tezos [XTZ] halted its up-channel recovery after the recent bearish break below the pattern. The $1.6-resistance provoked the sellers to recoup their power and pull XTZ below the EMA ribbons. After the recent spike in selling pressure, XTZ could continue seeing near-term setbacks.
Looking at the south-looking tendencies of the EMAs, the buyers could face a tough time steering the near-term trend as per their fancy. At press time, XTZ traded at $1.519, down by nearly 6.24% in the last 24 hours.
XTZ 4-hour Chart
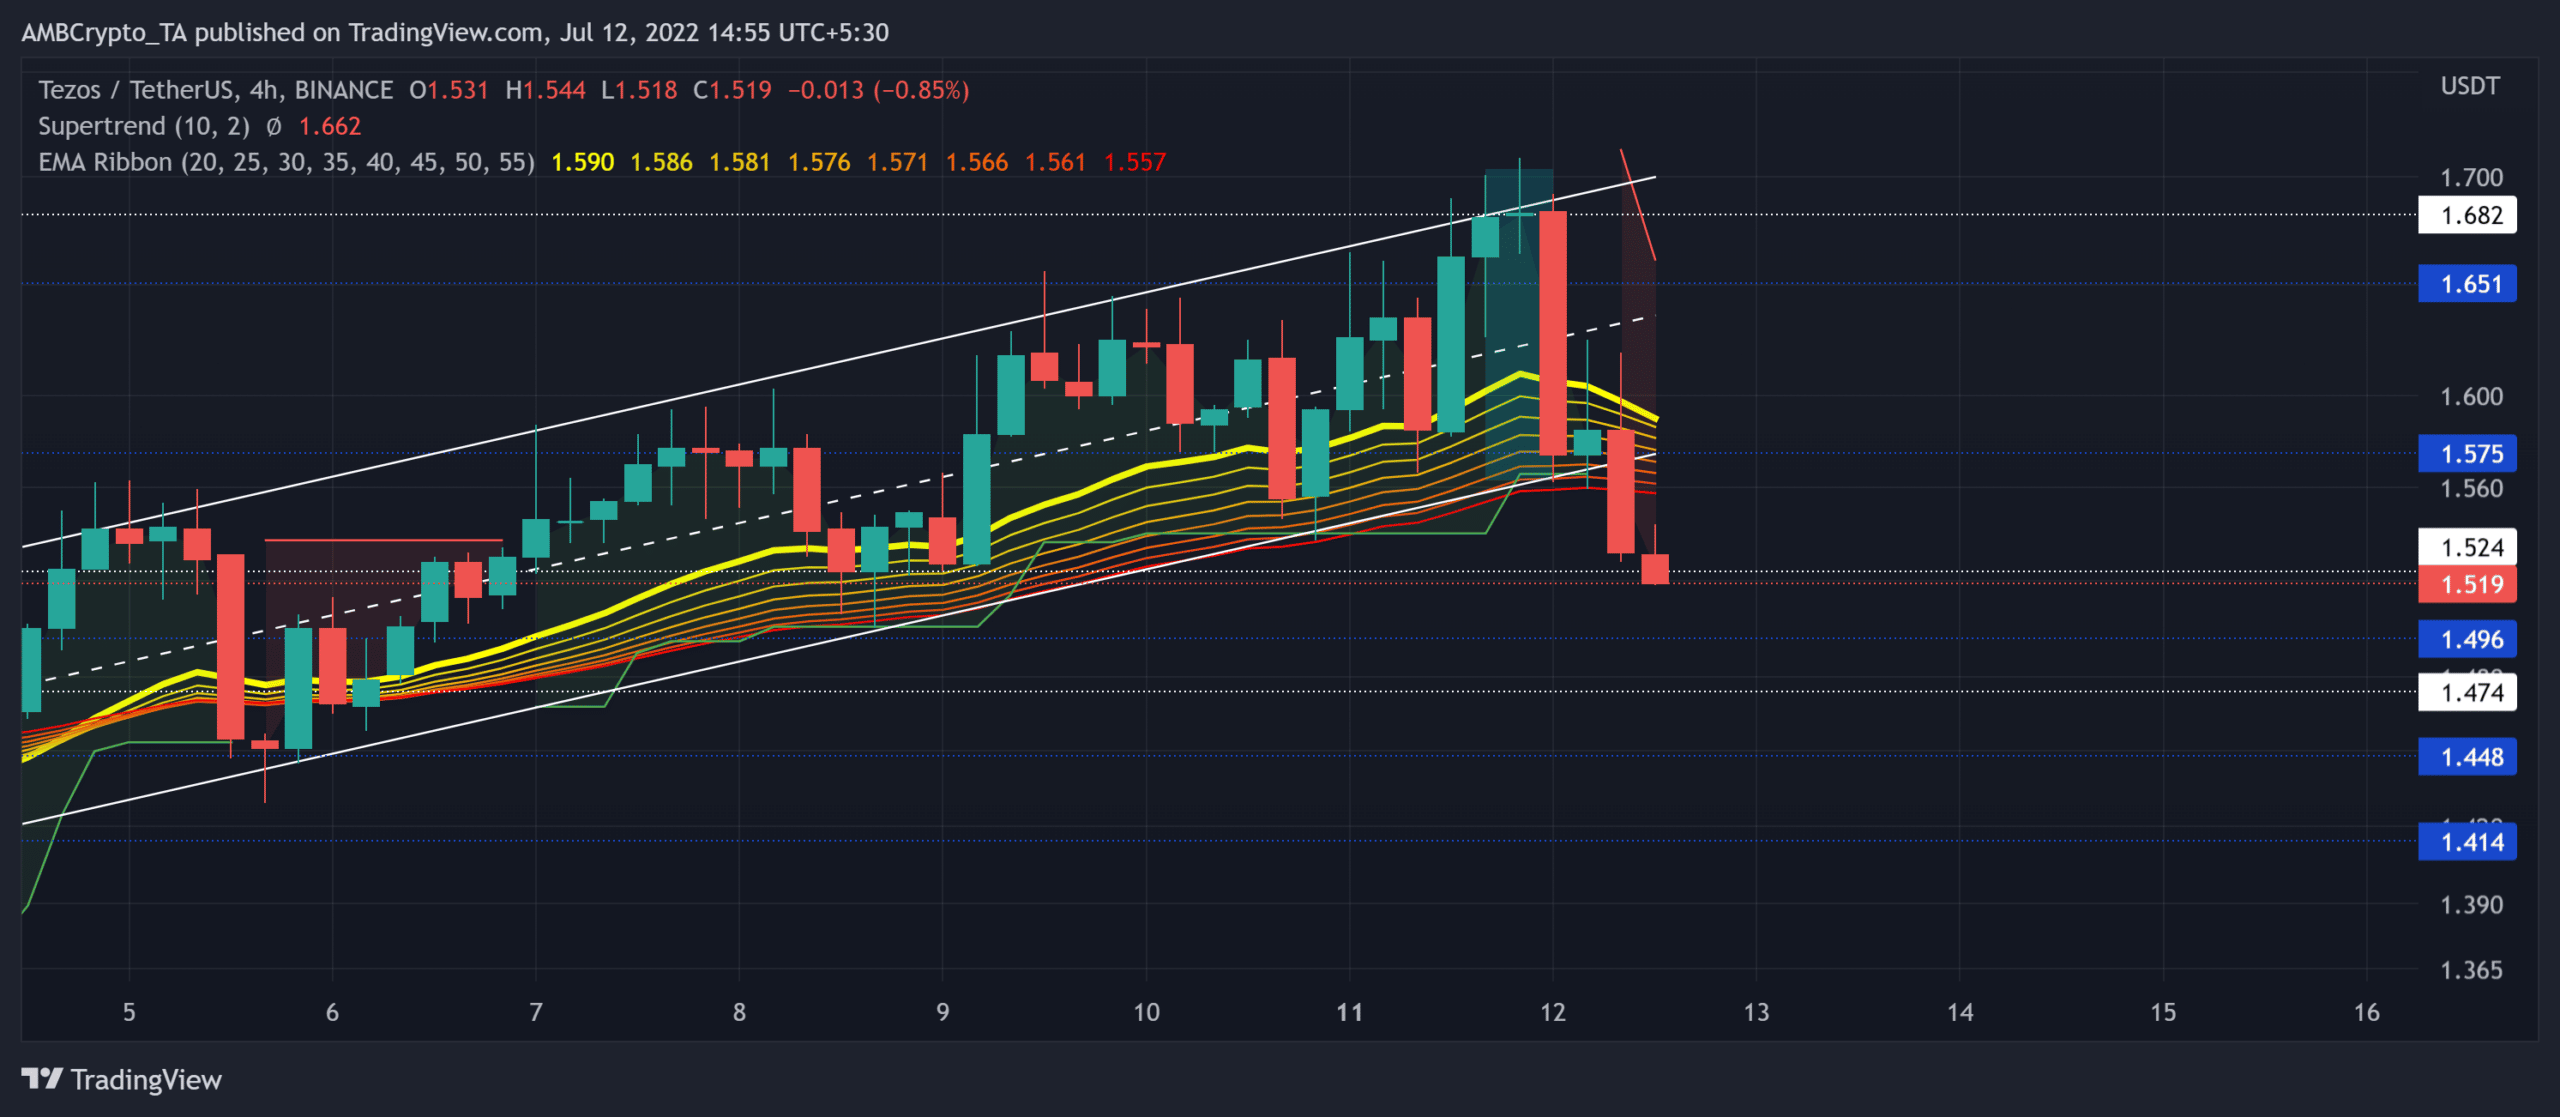
In the previous bearish pull from the $2.2-mark, XTZ lost nearly half its value as it snapped through numerous vital price levels. Thus, pushing the price action below the EMA ribbons.
However, the bulls have shown a gradual resurgence from the alt’s 27-month low on 19 June. The buyers had been guarding the $41.2-mark support for over two years now. Thus, the alt marked a steady revival on its peaks and troughs.
Over the last few days, XTZ saw an up-channel that helped buyers reclaim a spot above the EMA ribbons.
As the price broke down from this up-channel, the bears could aim to break below the $1.5-support in the coming sessions. Also, the Supertrend took a bearish stance by turning red and looking south in the last few hours.
Any close below the $1.5-mark could aggravate the selling efforts. In this case, the potential shorting targets would lie in the $1.47-$1.49 range. However, a sudden bullish resurgence should find testing resistance near the $1.57 zone.
Rationale
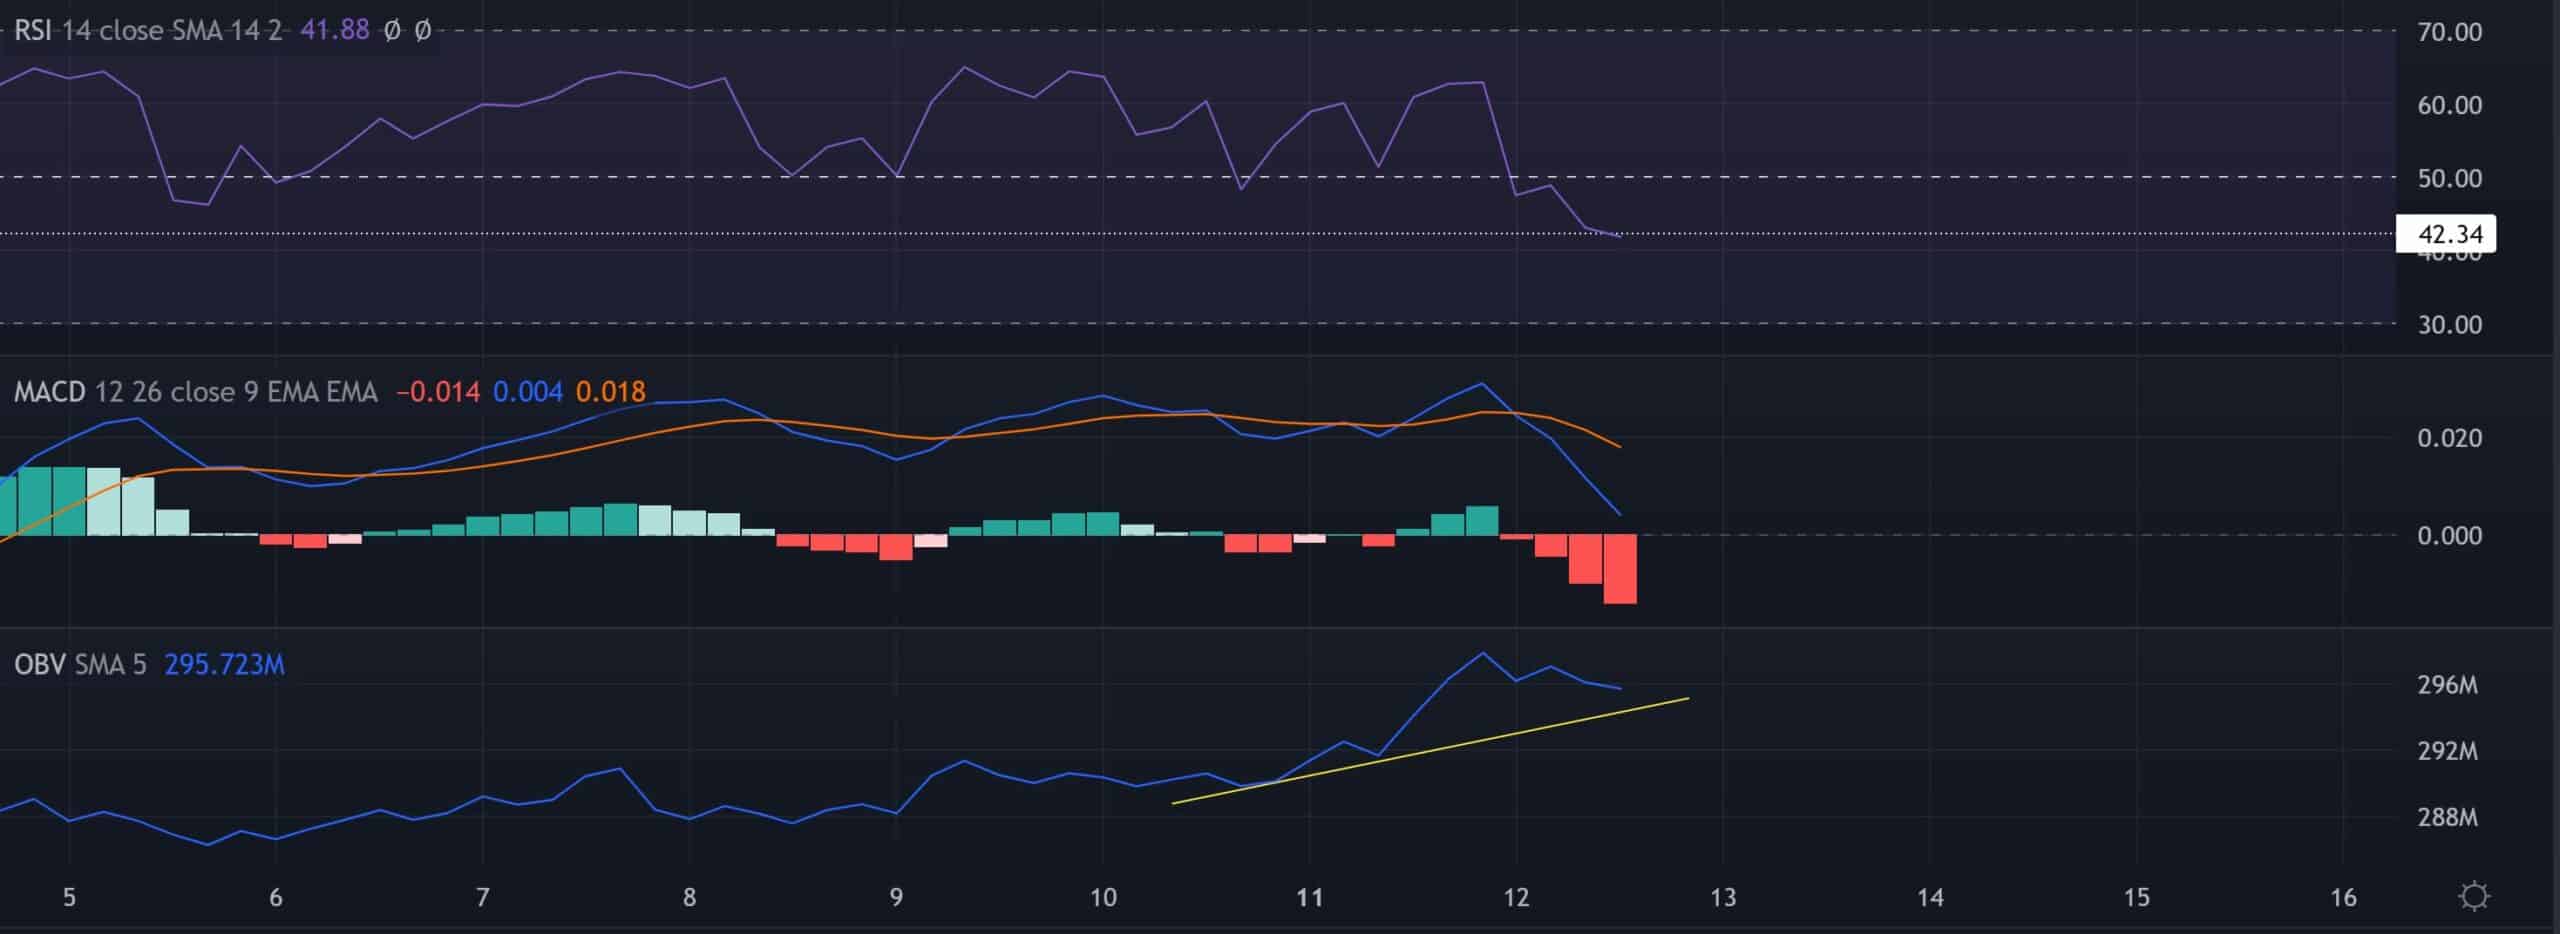
The RSI lost its position above the midline and revealed a bearish structure at press time. From here on, a potential revival from the 42-level could help the buyers hold their immediate grounds. But a fall below this level could hint at a further shift in momentum.
Also, the Moving Average Convergence Divergence (MACD) lines saw a bearish crossover and affirmed an increase in selling pressure. Any fall below the zero-mark would reaffirm the selling sign.
However, the OBV saw higher peaks in the last two days. Any bounce-backs from its trendline support could indicate a bullish divergence with price.
Conclusion
Given the evening star candlestick setup alongside the south-looking EMA ribbons, XTZ could continue its bearish inclinations. The targets would remain the same as above.
However, Bitcoin’s movement and the overall market sentiment need to be factored in as a complementary tool to make an accurate decision.


