
Disclaimer: The findings of the following analysis are the sole opinions of the writer and should not be considered investment advice
The market always moves in waves. And, for Polkadot, this wave has been mercilessly pushing the price lower since November. The early February rally brought hope with it.
On the longer timeframe charts, bulls hope that Polkadot would be able to form an accumulation phase and break out of the downtrend. In other news, Polkadot as a network has been a big part of crypto-donations to Ukraine over the past few days.
DOT- 12 hour chart
Source: DOT/USDT on TradingView
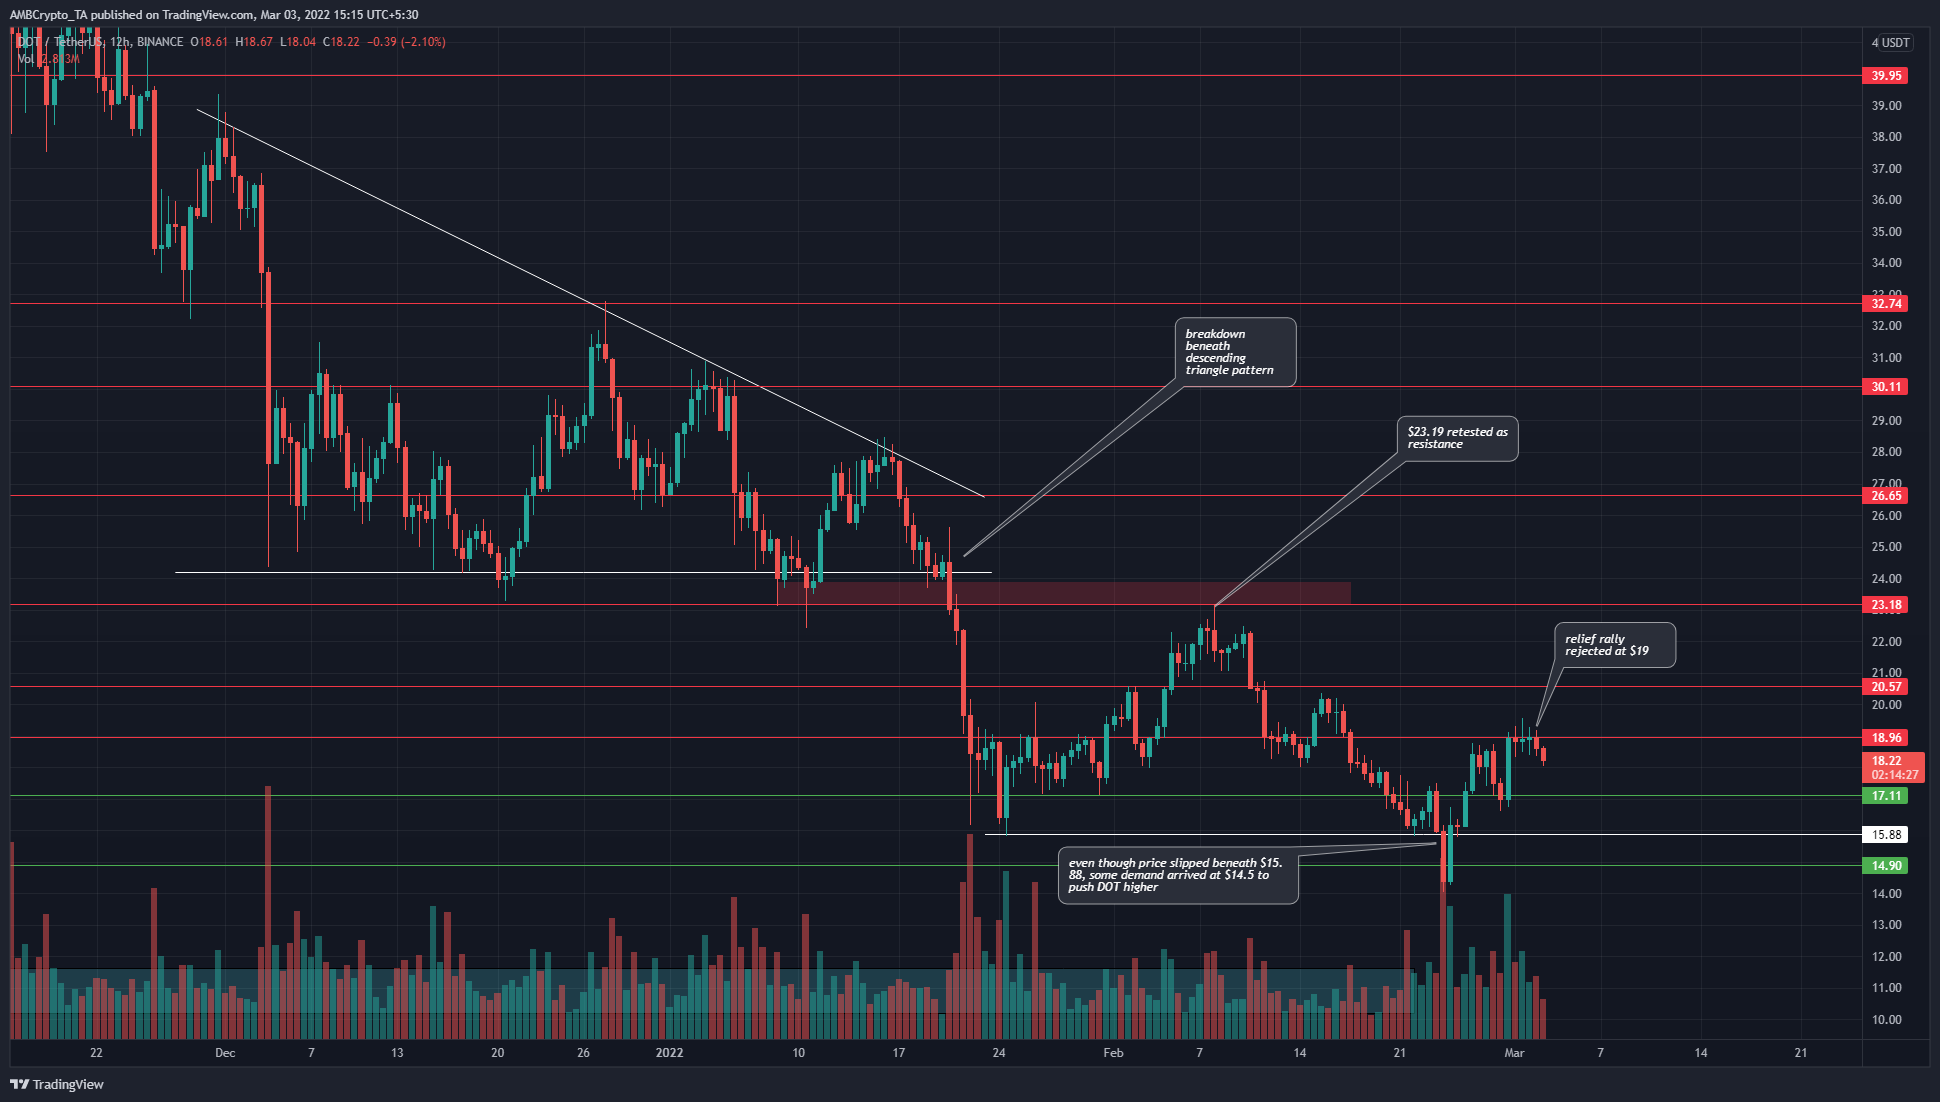
Market uncertainty and Bitcoin’s fall under the $40,000-level prompted DOT to slide beneath $24. In the weeks since then, Bitcoin has hauled itself back above the $40,000 to trade at $43,200 at press time. And yet, DOT saw no such reprieve.
Moreover, the price fell beneath the previous lows at $15.88 to fall as far south as $14.5 before finding demand. This is more likely to be contrarian traders who saw an opportunity after the steep drop – rather than investors who see DOT to be in an area of value.
The market structure, at press time, was bearish – and the previous lows appear to have been breached. $20.5 and $19 have rejected the price too.
Rationale

Source: DOT/USDT on TradingView
The RSI was unable to climb past the 56-mark, which has been a relatively important level in the past few months. Generally, a move above 55-60 on the RSI has heralded gains for DOT. Consistently being above this level would indicate a strong uptrend. Instead, the RSI has stayed under the neutral 50-level to denote a downtrend for the past three months.
The Awesome Oscillator poked its nose above the zero line but could be forced back under due to the rejection at $19.
The OBV has been sliding south consistently. This is a sign that selling volume has steadily outmuscled buying volume in recent months.
Conclusion
For Polkadot, the sellers have consistently had the upper hand since December. It shed too much value when Bitcoin fell. And, DOT has been unable to recover the value lost even though Bitcoin saw a relief rally. This was in stark contrast to certain other altcoins in the market which have rallied during days when Bitcoin traded sideways.
The market structure for DOT continues to be bearish. In the next few weeks, a drop towards $14 and lower cannot be ruled out.