The odds of Chainlink flipping its trend and what it means for LINK’s sellers

Disclaimer: The findings of the following analysis are the sole opinions of the writer and should not be considered investment advice
A telecom company based in Bahrain, Bahrain is reported to have launched its Chainlink node. Using this node, the company can provide smart contracts and support Chainlink Price Feeds.
This is the first time a telecom company based in the MENA region has launched a Chainlink node. On the charts, however, the price of the token looked likely to drop lower in the days to come.
LINK- 1 hour chart
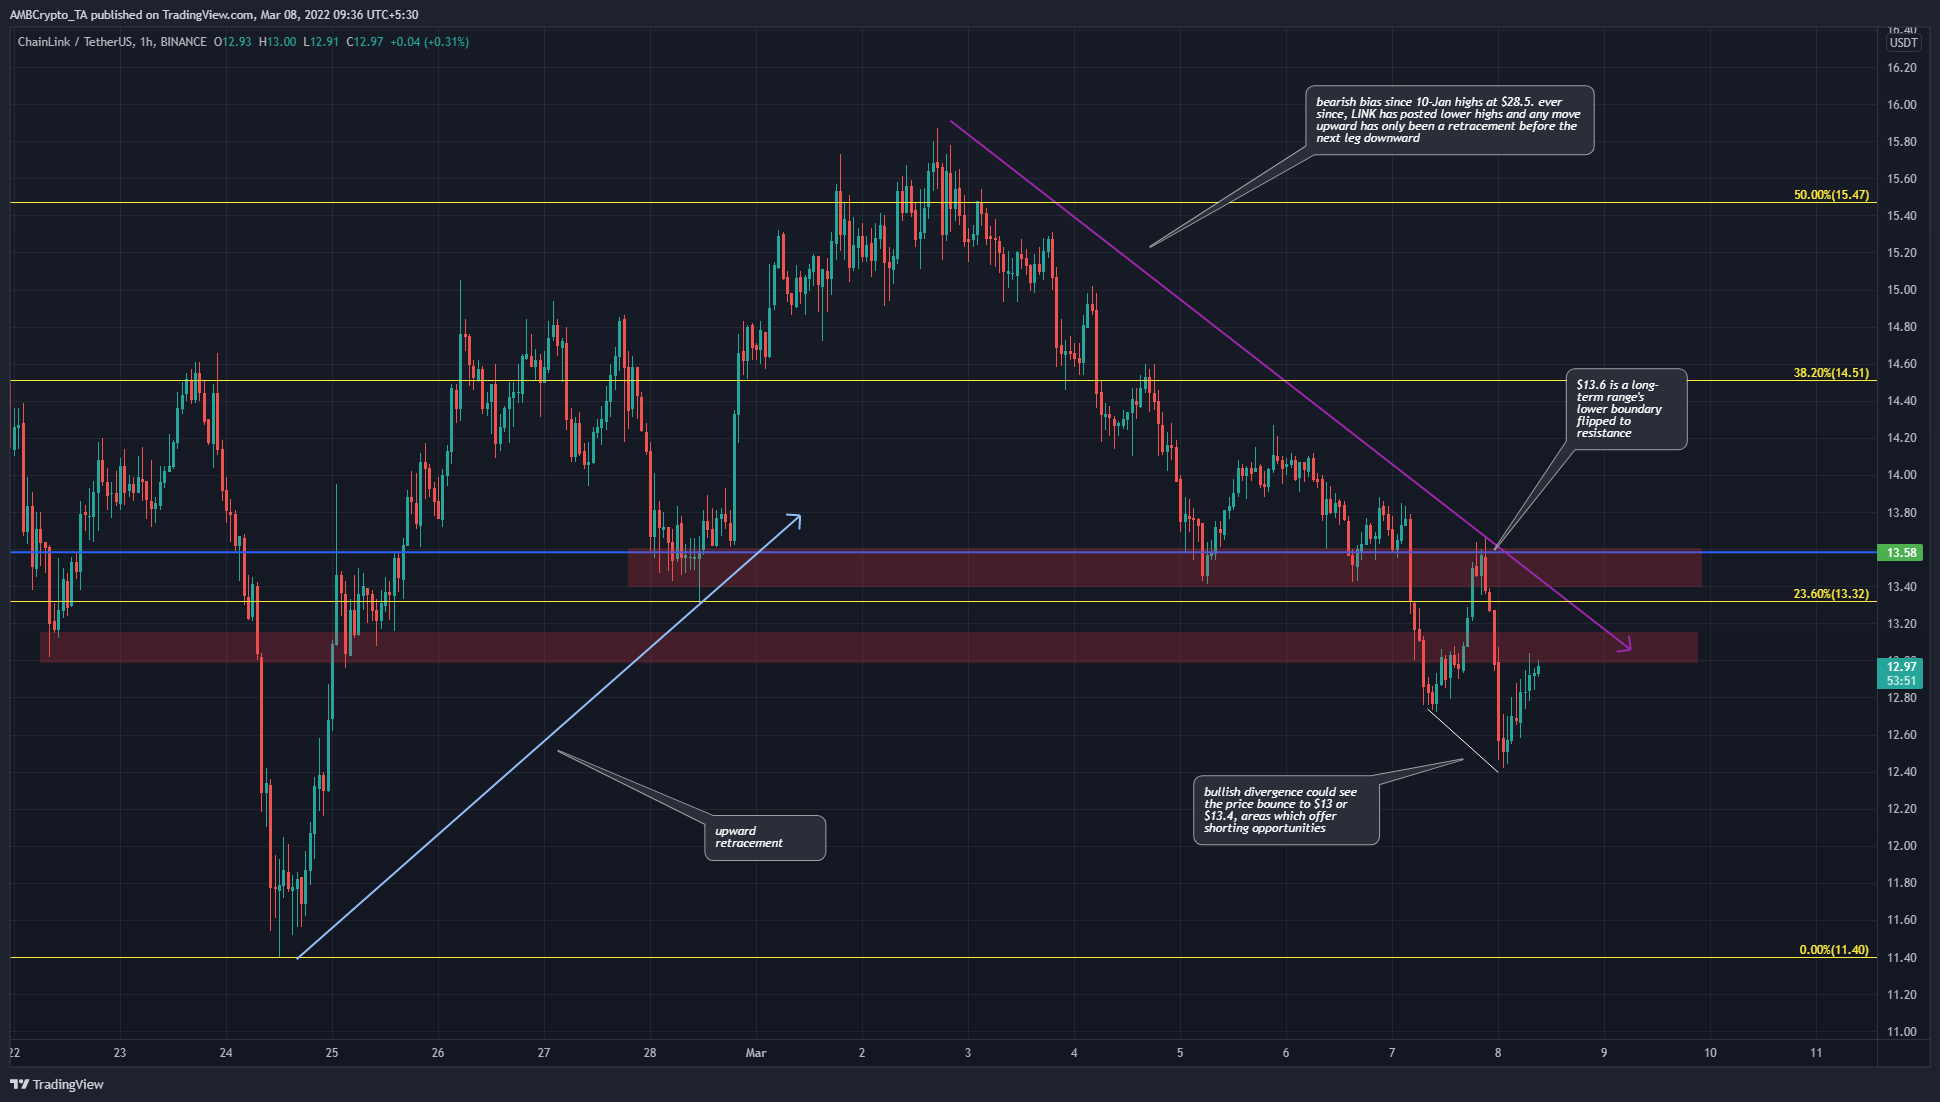
The longer-term trend behind LINK has been bearish since November. Even since mid-January, the coin has noted strong moves south, followed by a retracement to the north. This might have occurred once more in the past couple of weeks when LINK bounded from $11.4 to $15.8.
As far as the short-term outlook is concerned, the market structure for LINK seemed bearish. Moreover, the $13.6-level represented the lows of a range that Chainlink has traded within since May last year.
Therefore, $13.6 is an important level of support that has been lost once again to bearish pressure. The $13 and $13.6 areas have seen demand arrive in the past two weeks. Since LINK was trading under these areas, a retest of this area of supply would be likely to face rejection and see a move downward.
Rationale
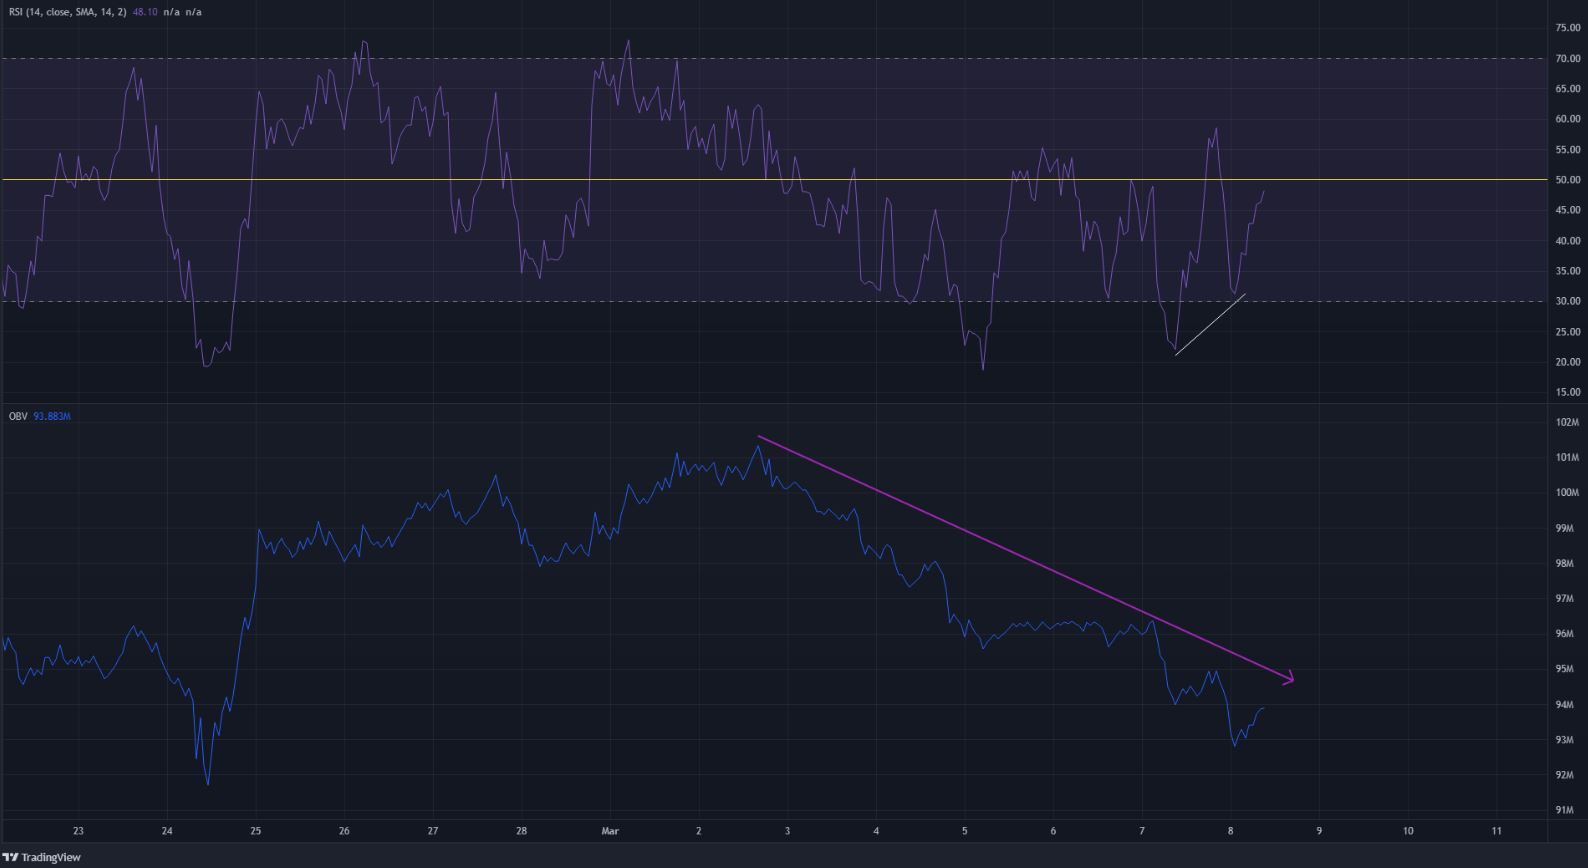
The RSI has been below neutral zero for almost the entirety of March. Over the last few days, there was a bullish divergence between the RSI and the price on the hourly chart. However, the predominant trend has been bearish. Hence, any bounce in price would likely be a selling opportunity.
The OBV has also been on a clear downtrend over the past week to highlight the strong bearish presence in LINK markets.
Conclusion
The market structure was bearish and longer timeframes established that upward moves for LINK are likely to be retracements. Once LINK dropped below $14.4, the near-term bias also flipped to bearish and it continues to be bearish.
The bullish divergence that has developed in the past couple of days could see LINK bounce to $13-$13-6. Selling pressure behind the coin is likely to see LINK rejected at these resistances and move south once again.


