The Sandbox revisited an area of demand, the sellers have been…

The Sandbox had been on a strong rally in late October. It gained nearly 1000% in a month and has established itself as one of the stronger metaverse coins in the market. In fact, it had a market cap of 14.7 billion dollars, at the time of writing. Interestingly, a week ago, The Sandbox bounced off the $5.79 support level. However, it was noted that the $4.5 was an area of demand that could possibly be revisited.
SAND- 1D
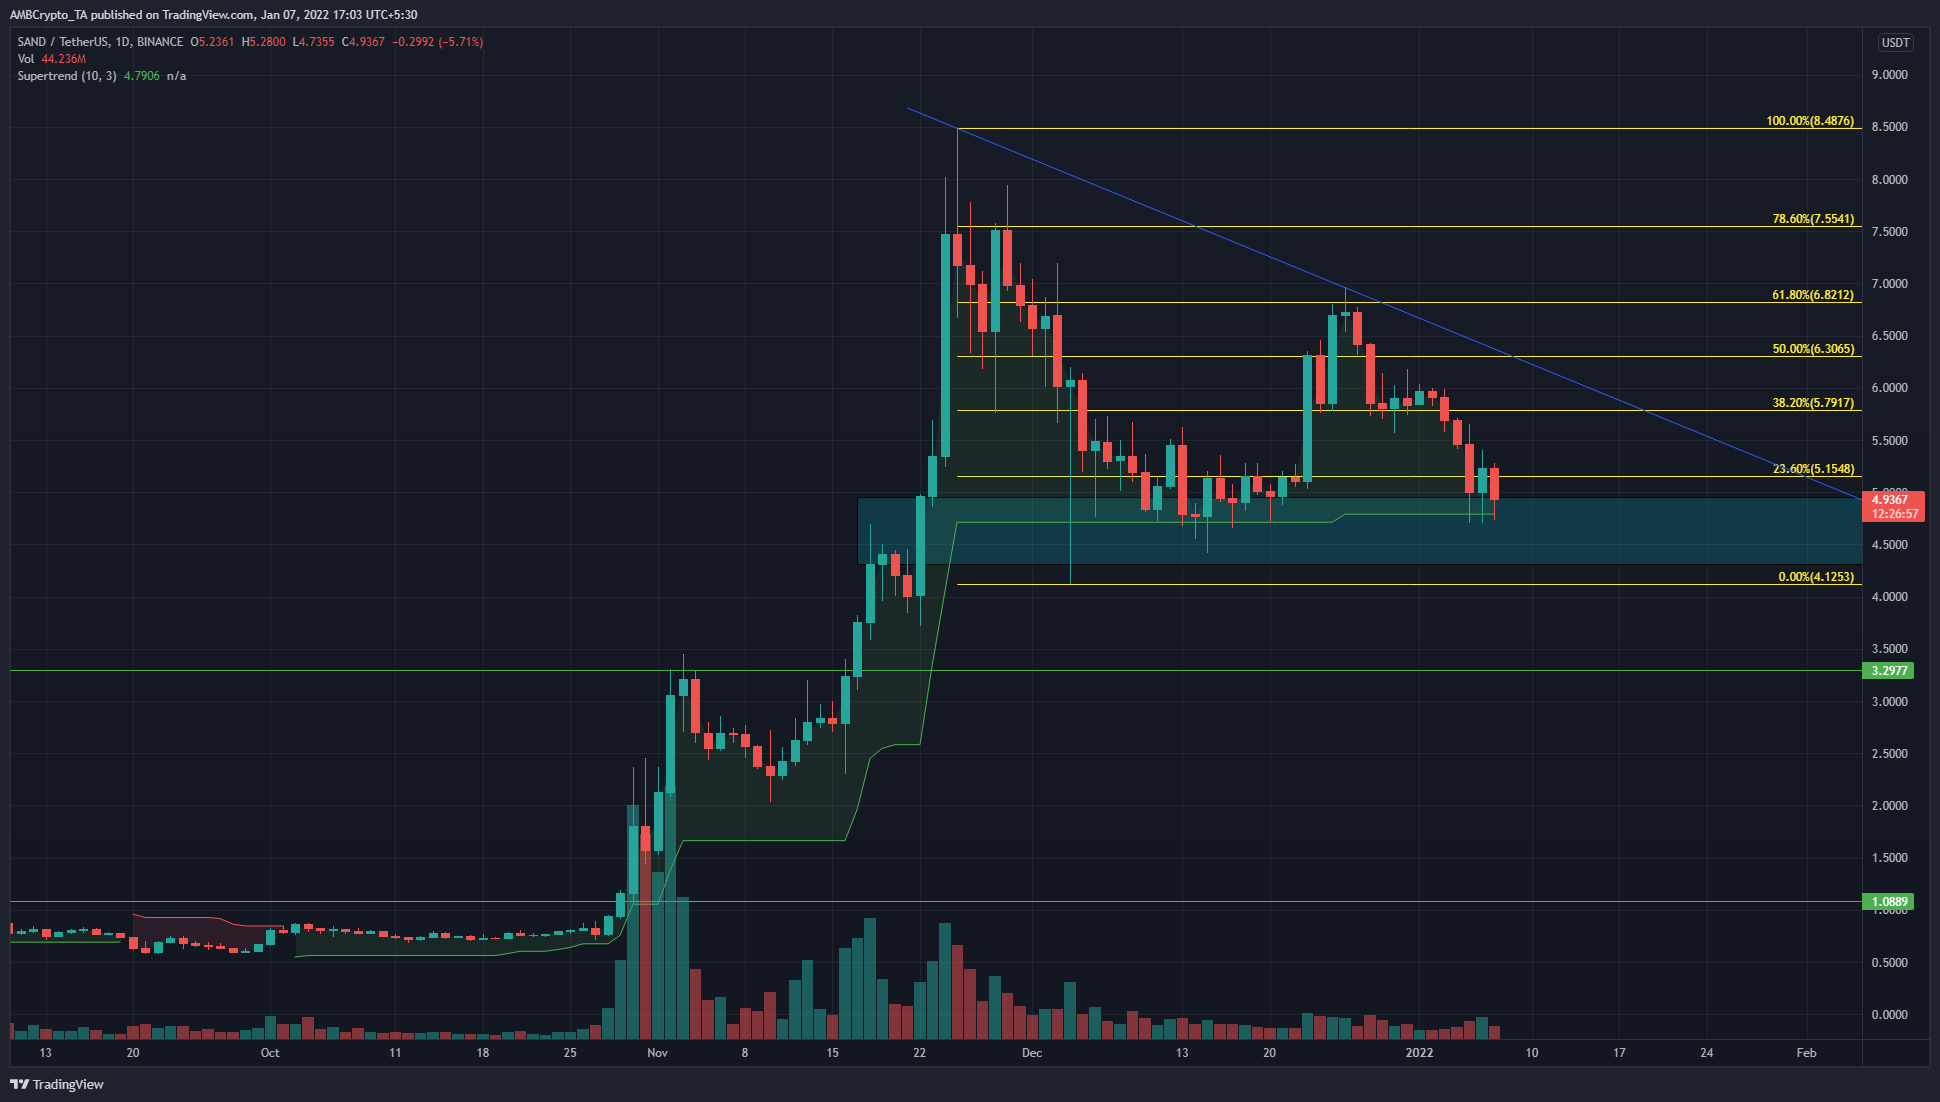
In mid-November, the $4.5 area halted SAND’s advance for a few days before buyers were able to drive the price past this area. The revisit of this was in mid-December, thus, establishing it as an area where buyers were likely to step in.
Repeated retests of a significant level, support or resistance, weakens the level. Combined with the descending trendline (blue), the way forward for SAND appeared to be a bounce from the cyan box and a test of the trendline resistance over the next few days/weeks.
A rejection at the trendline could see SAND drop back to $4.7 and form a triangle pattern primed to break out. Although the direction of the break out would need a candle close outside the pattern for confirmation. If SAND managed to break past the trendline resistance, it would encourage buyers to step in, and either the trendline itself or the Fibonacci retracement levels can be used to enter a long position.
Rationale
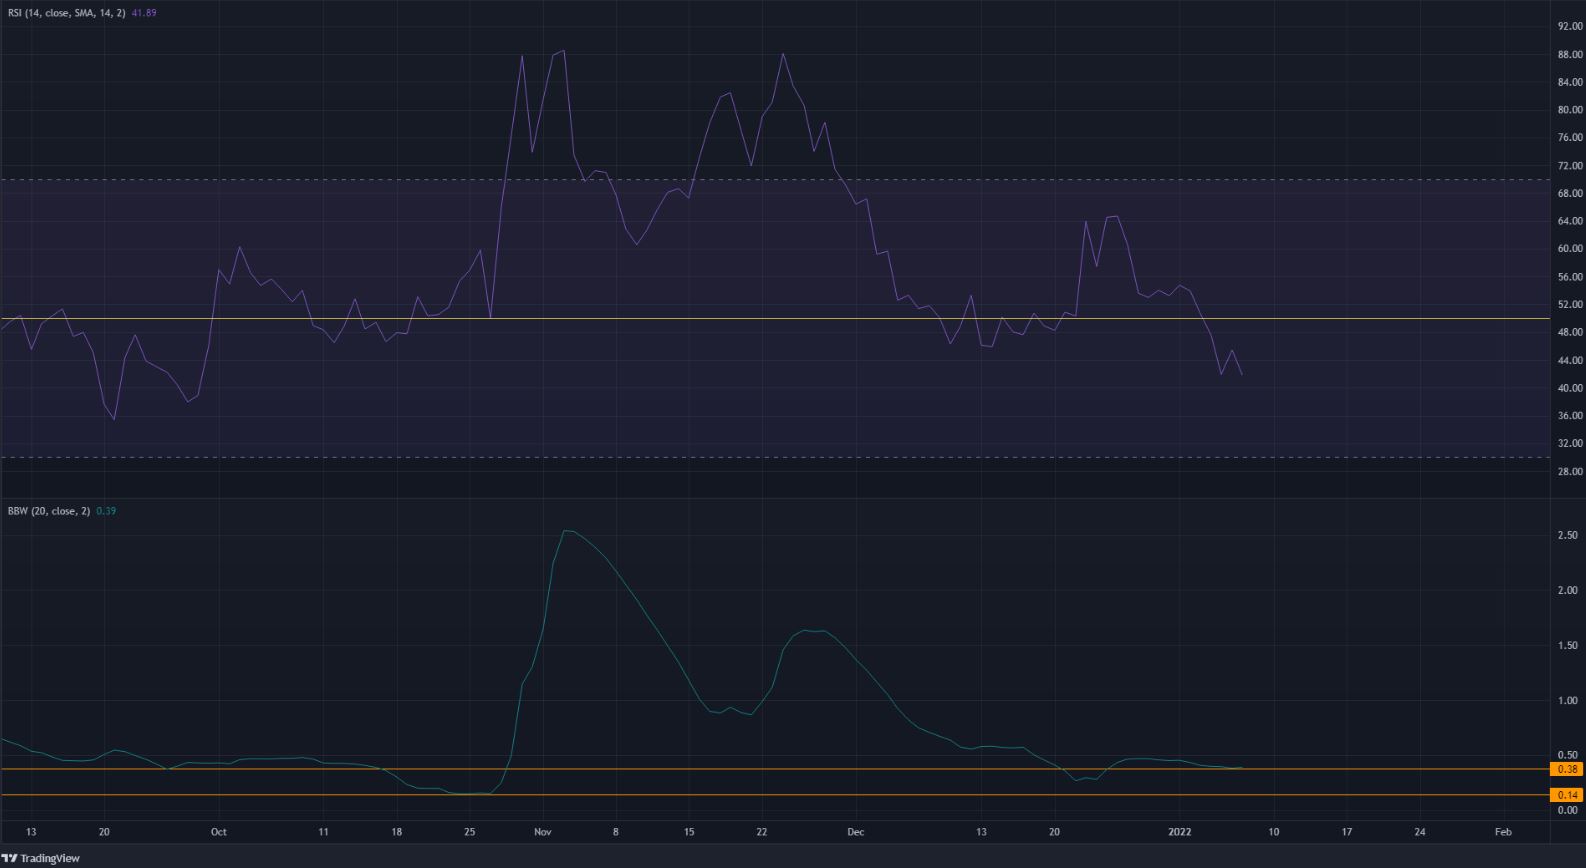
The RSI was below neutral 50, although it had not fallen as low as the 36 mark yet.
Two levels were marked on the daily Bollinger bands width indicator. The lower level indicated the daily Bollinger bands had a low width in late October (as well as mid-August, when SAND climbed from $0.6 to $1) before the explosive 10x rally. The upper level marked a level where SAND BB bands’ width had repeatedly revisited throughout the year (April, June, and September).
When the width drops as low as these levels, it would likely be followed by a rally. Hence, along with a demand area, a constricted set of Bollinger bands showed SAND was at a good area to accumulate.
Conclusion
Both the price chart and the indicators showed that, while SAND leaned bearishly, it was actually trading at an area of value on the charts. A breakout could follow. However, if Bitcoin continued to slide lower, it could negatively affect The Sandbox’s price.


