The Sandbox [SAND] manages to defend $1 level but can it sustain a breakout

Disclaimer: The findings of the following analysis are the sole opinions of the writer and should not be considered investment advice.
The Sandbox was steadily moving lower and lower on the price charts, as the trend across the crypto market has also been especially bearish in the past two months. There were no signs yet that SAND could reverse its losses, and long-term investors would need to be wary of buying an asset in a steady downtrend.
Bitcoin rose past the $30.6k mark to reach $32.2k in the past couple of days, but this short-term bullish move was quickly retraced. On lower timeframes, the $1.51 mark was important, but even a move above this level was only likely to see a relief rally and not a trend reversal.
SAND- 1 Day Chart
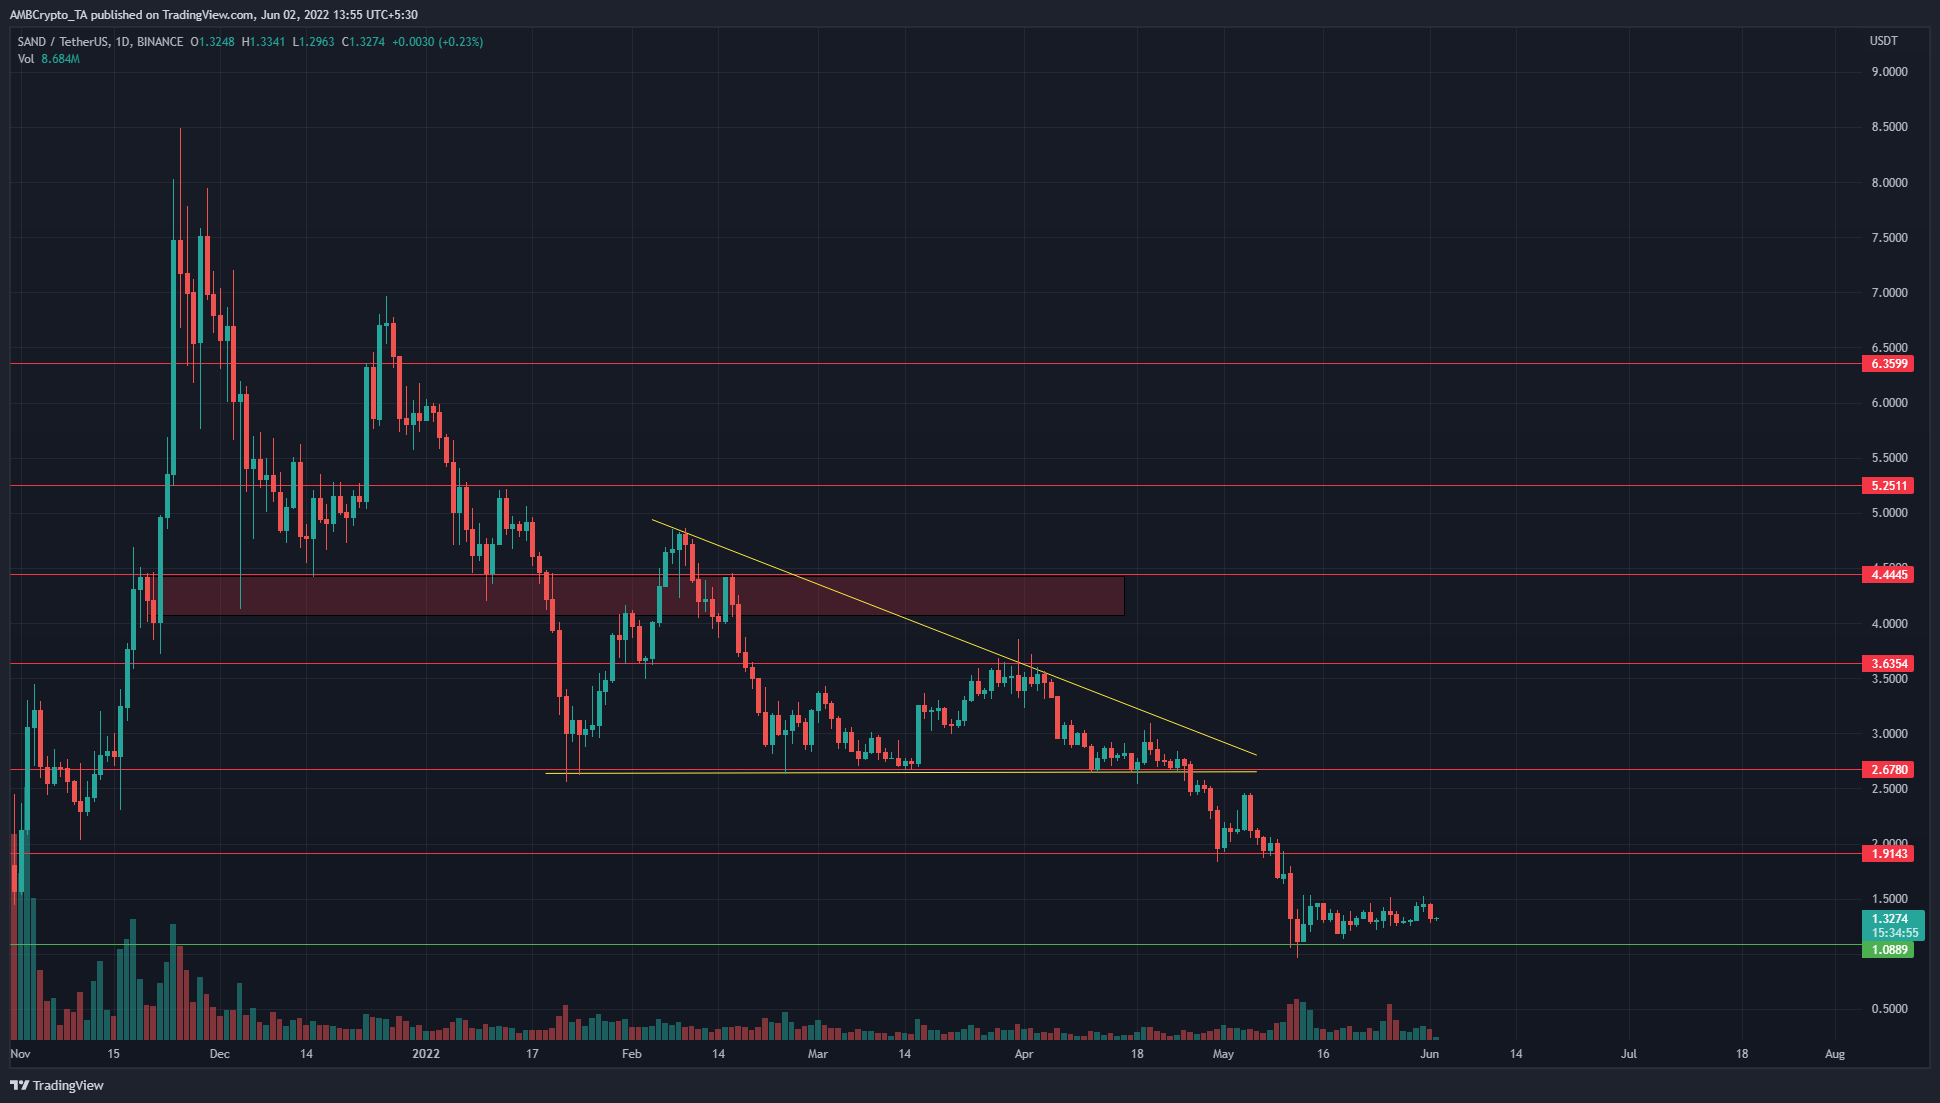
In February, March, and April, SAND formed a series of lower highs while it held on to the $2.67 support level, and formed a descending triangle pattern. In late April, the price fell beneath the pattern and fell another 58% to test the $1.08 support level.
The $1 area was defended by the bulls, but the past couple of weeks have seen the price between the $1.17 and the $1.51 levels. This meant that volatility has reduced in recent days, but the market structure remained overwhelmingly bearish for SAND.
The bulls would want to see SAND hold on to the $1 psychological and technical support in the weeks to come, and would want to see signs of accumulation above support. Such a development could see SAND rally upwards, toward the $2.5 mark.
However, the price could also topple beneath the $1 mark and go sliding lower.
Rationale
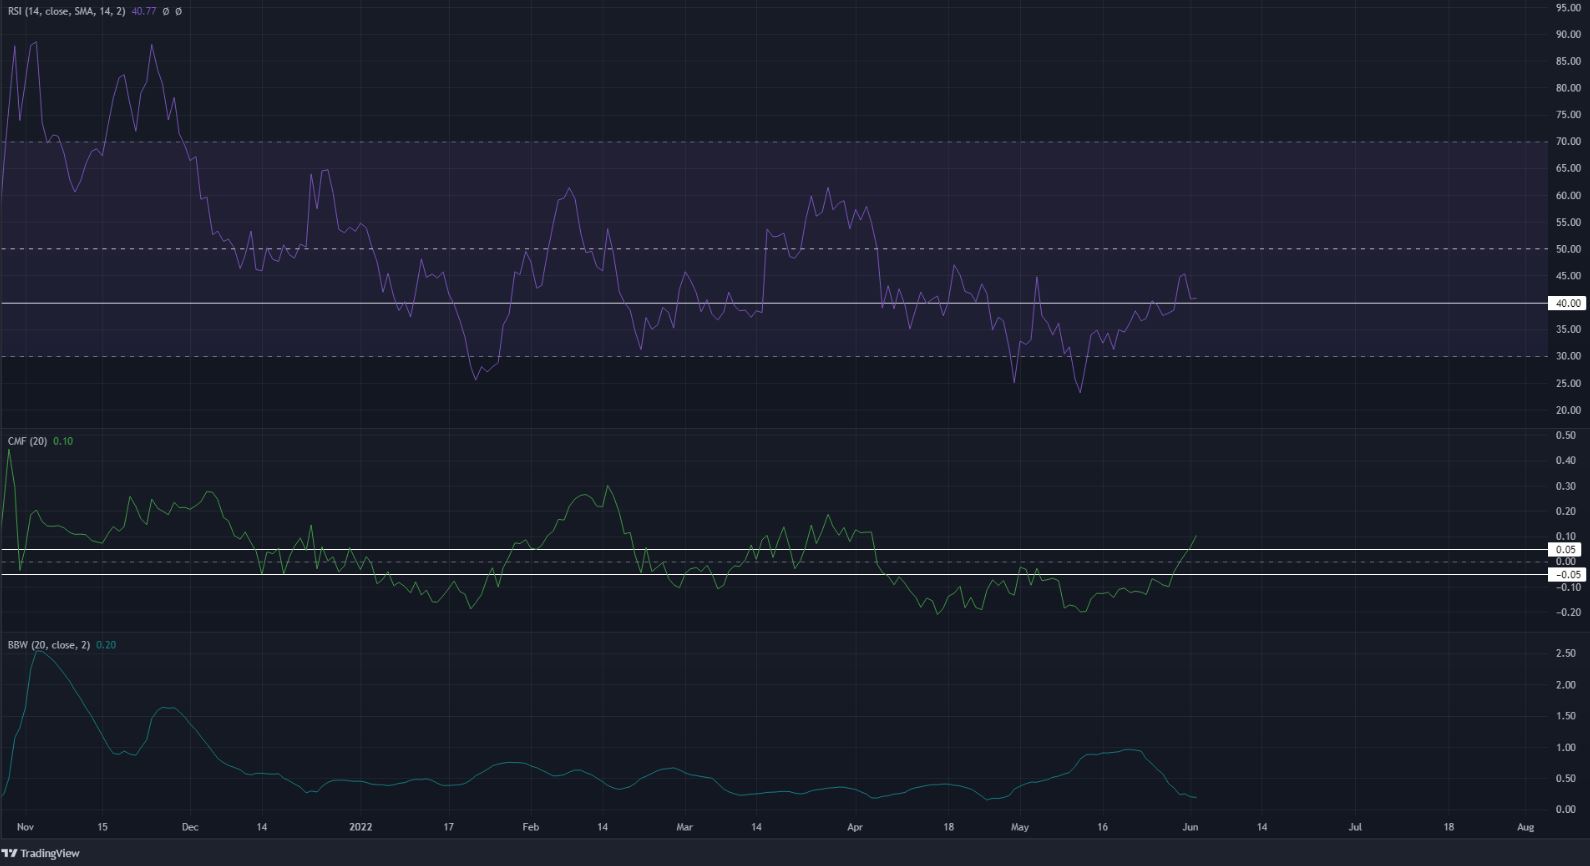
The RSI appeared to have flipped the 40 mark from resistance to support and indicated that the bearish momentum had weakened somewhat. However, since the RSI was below neutral 50 and has been since April, the trend was pointed downward.
The CMF also climbed above the +0.05 mark to show that buying pressure was on the rise for SAND, and the inbound capital flow could help the struggling bulls. In the next few days, if the CMF can stay above +0.05 and the RSI manages to climb past neutral 50, SAND could be gearing up for a move past $1.51.
The Bollinger band width indicator has been falling in the past two weeks to show the drop in volatility.
Conclusion
It was not yet clear whether SAND would move above $1.51, or below $1.08. A wait-and-watch approach would be pertinent, as Bitcoin was also somewhat undecided about its own trend.
For long-term investors of The Sandbox, the $1.93 and $2.5 levels are more likely to offer selling opportunities than buying ones in the next week or two, should the prices climb that high.


