Shiba Inu: Here’s how SHIB could react to the ongoing skepticism in the market

Disclaimer: The findings of the following analysis are the sole opinions of the writer and should not be considered investment advice.
After declining below its EMA ribbons, Shiba Inu [SHIB] took a plunge below its five-month trendline resistance (yellow, dashed).
The current structure exhibited a bearish edge despite a break above its near-term down-channel (yellow). A potential close above or below the trendline resistance could influence the upcoming trend of the dog-themed token. (For brevity, SHIB prices are multiplied by 1000 from here on).
At press time, SHIB traded at $0.01106, down by 5.82% in the last 24 hours.
SHIB Daily Chart
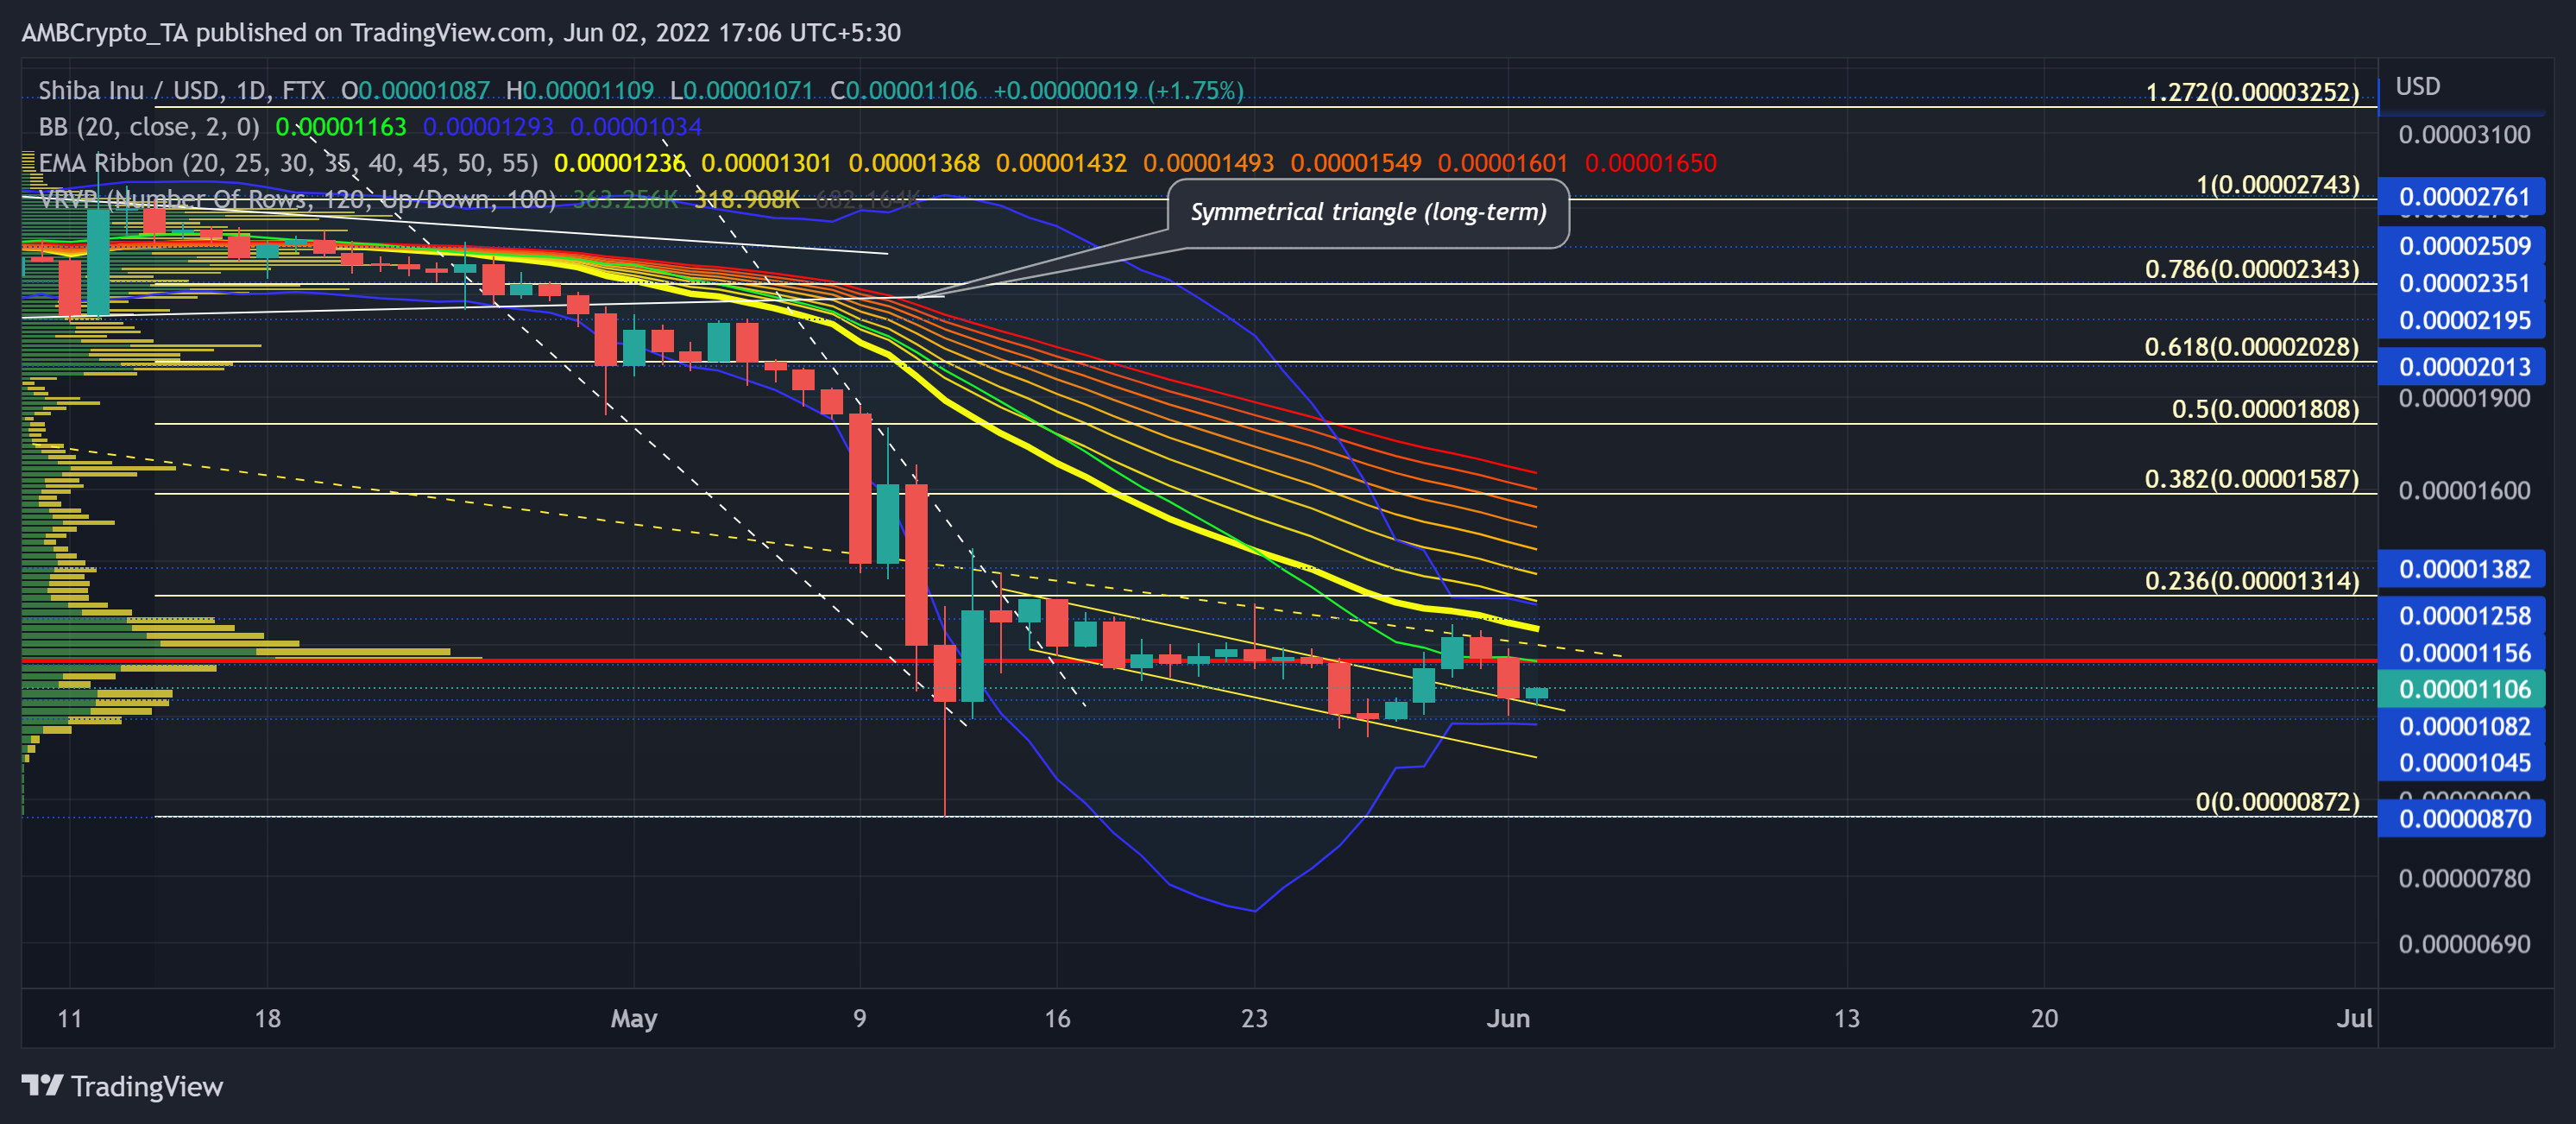
SHIB found a consolidation range between the $0.02-$0.032 for over four months while the bears kept increasing their pressure near the 61.8% Fibonacci level.
Eventually, the symmetrical triangle structure saw a down break breakout due to the token’s previous downtrend. The fall below the golden Fibonacci level registered a 60% drop toward its seven-month low on 12 May.
As a result, the distance between the south-looking EMA ribbons has been at its record high. With relatively low volumes, SHIB has been hovering near its Point of Control (POC, red) for the last three weeks.
With the reduced gap between the lower and upper bands of the Bollinger Bands (BB), SHIB could see an extended squeeze near the POC. A close above the immediate trendline resistance would position the alt for a test of the 23.6% level in the $0.013 region.
Rationale
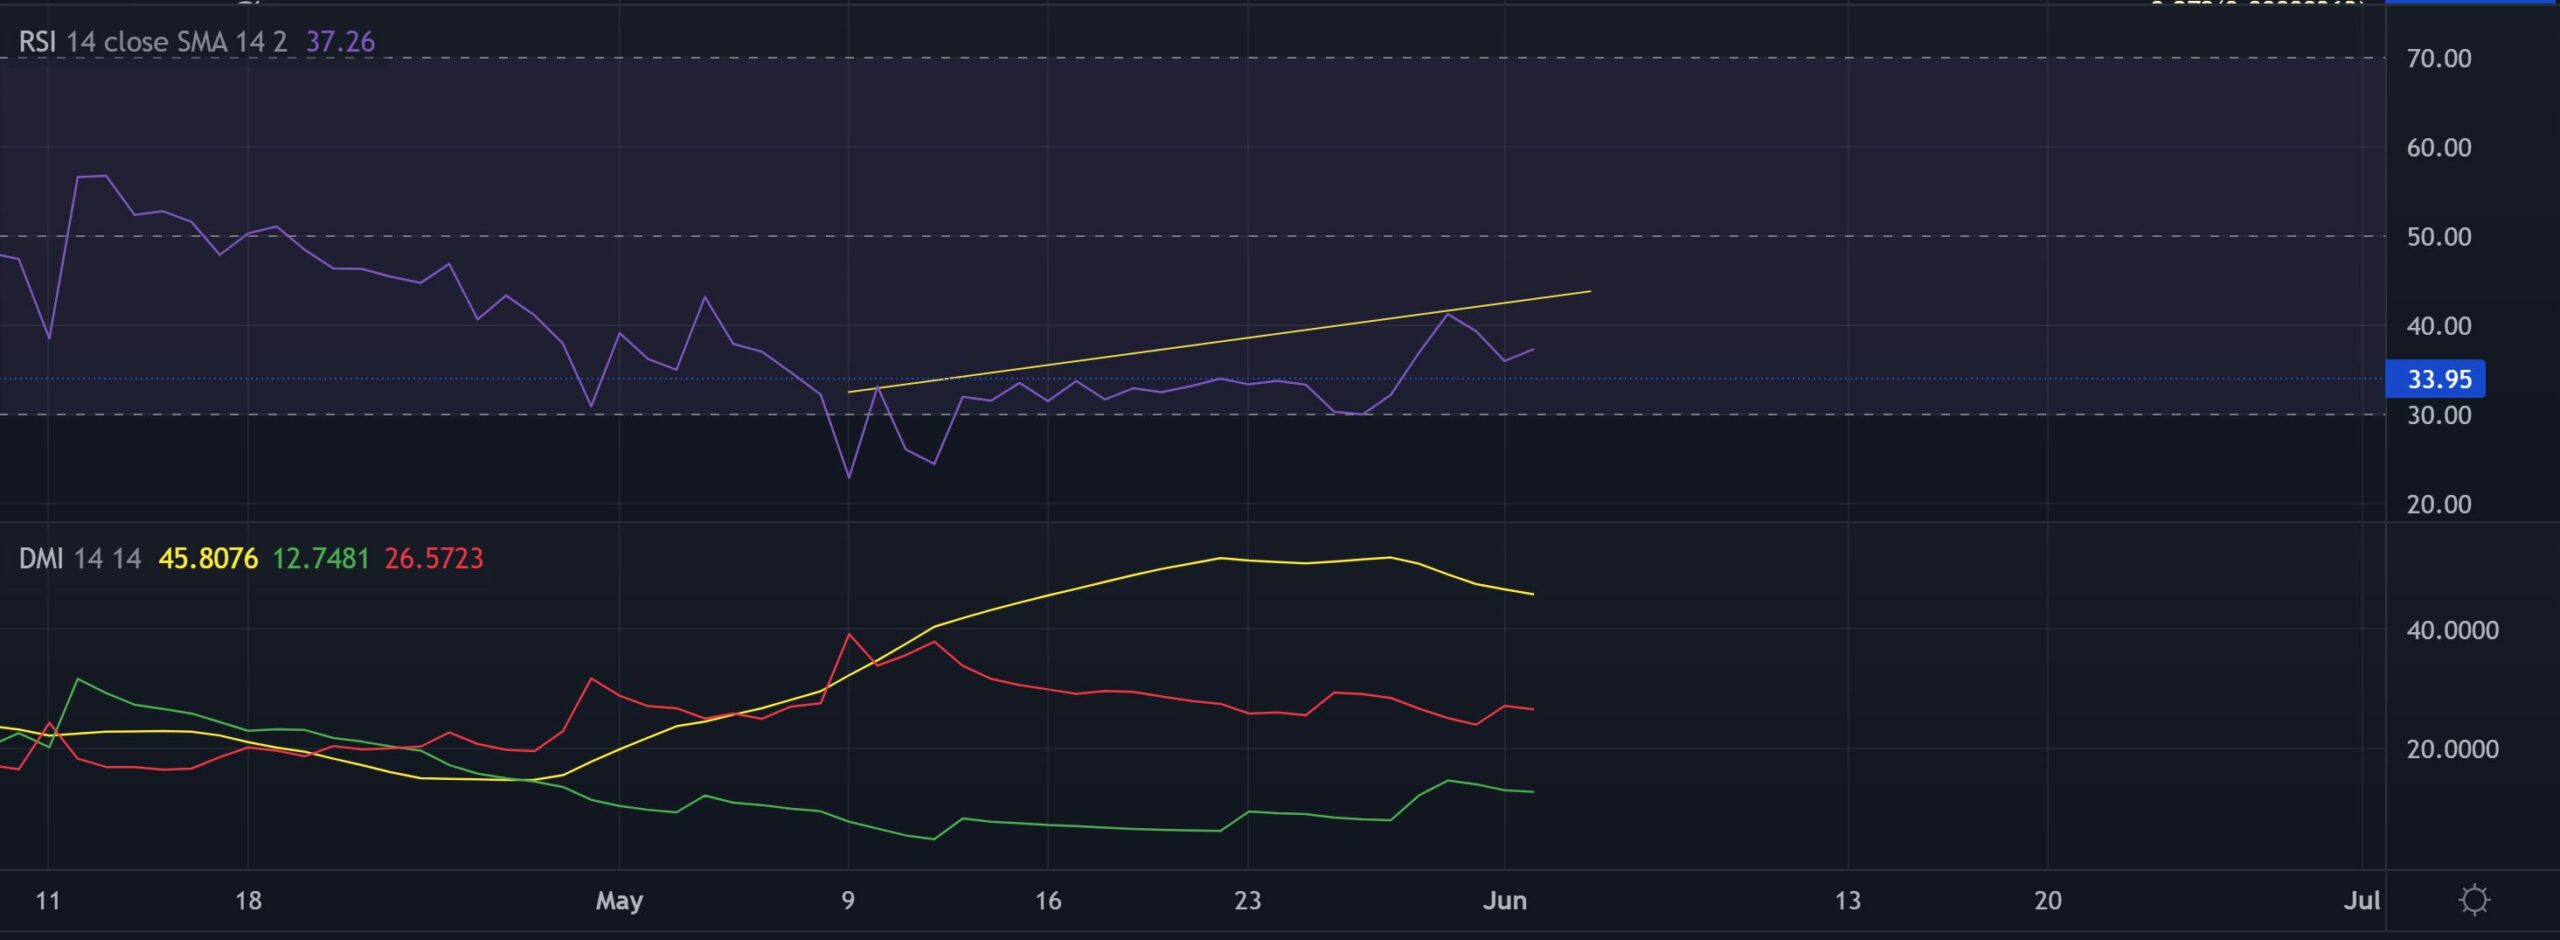
After testing the 33-mark multiple times, the RSI found its way to test its trendline resistance. This trajectory hinted at an ease in the selling pressure. But the recent bearish divergence with the price has added fuel to the bearish fire on the chart.
Furthermore, the DMI lines were yet to see a bullish crossover since April. So unless the buyers ramp up the buying volumes, SHIB could see an extended tight phase at the very least.
Conclusion
The indications on the chart as well as on the technical front visibly favored the sellers. A convincing close beyond the POC and 20 EMA could bag in near-term gains in the coming sessions.
But a bullish inability to cross these levels seemed rather likely due to the current uncertainty across the market.
Even so, the alt shares a staggering 95% 30-day correlation with Bitcoin. Hence, keeping an eye on Bitcoin’s movement with the overall market sentiment could be essential for making a profitable move.


