These metrics reveal why investors feel this way about Ethereum right now

Ethereum and its metrics are not looking hot at the moment. The price action is not in a good condition either, as the coin fell by 20% in the last 10 days. Somehow, despite the positive news of The Securities and Exchange Commission of Brazil (CVM) approving the first-ever Ethereum ETF on a Latin American exchange, investments are still pretty weak. The following on-chain metrics shed light on why Ethereum did not make any bullish movements.
Ethereum is not investor-friendly
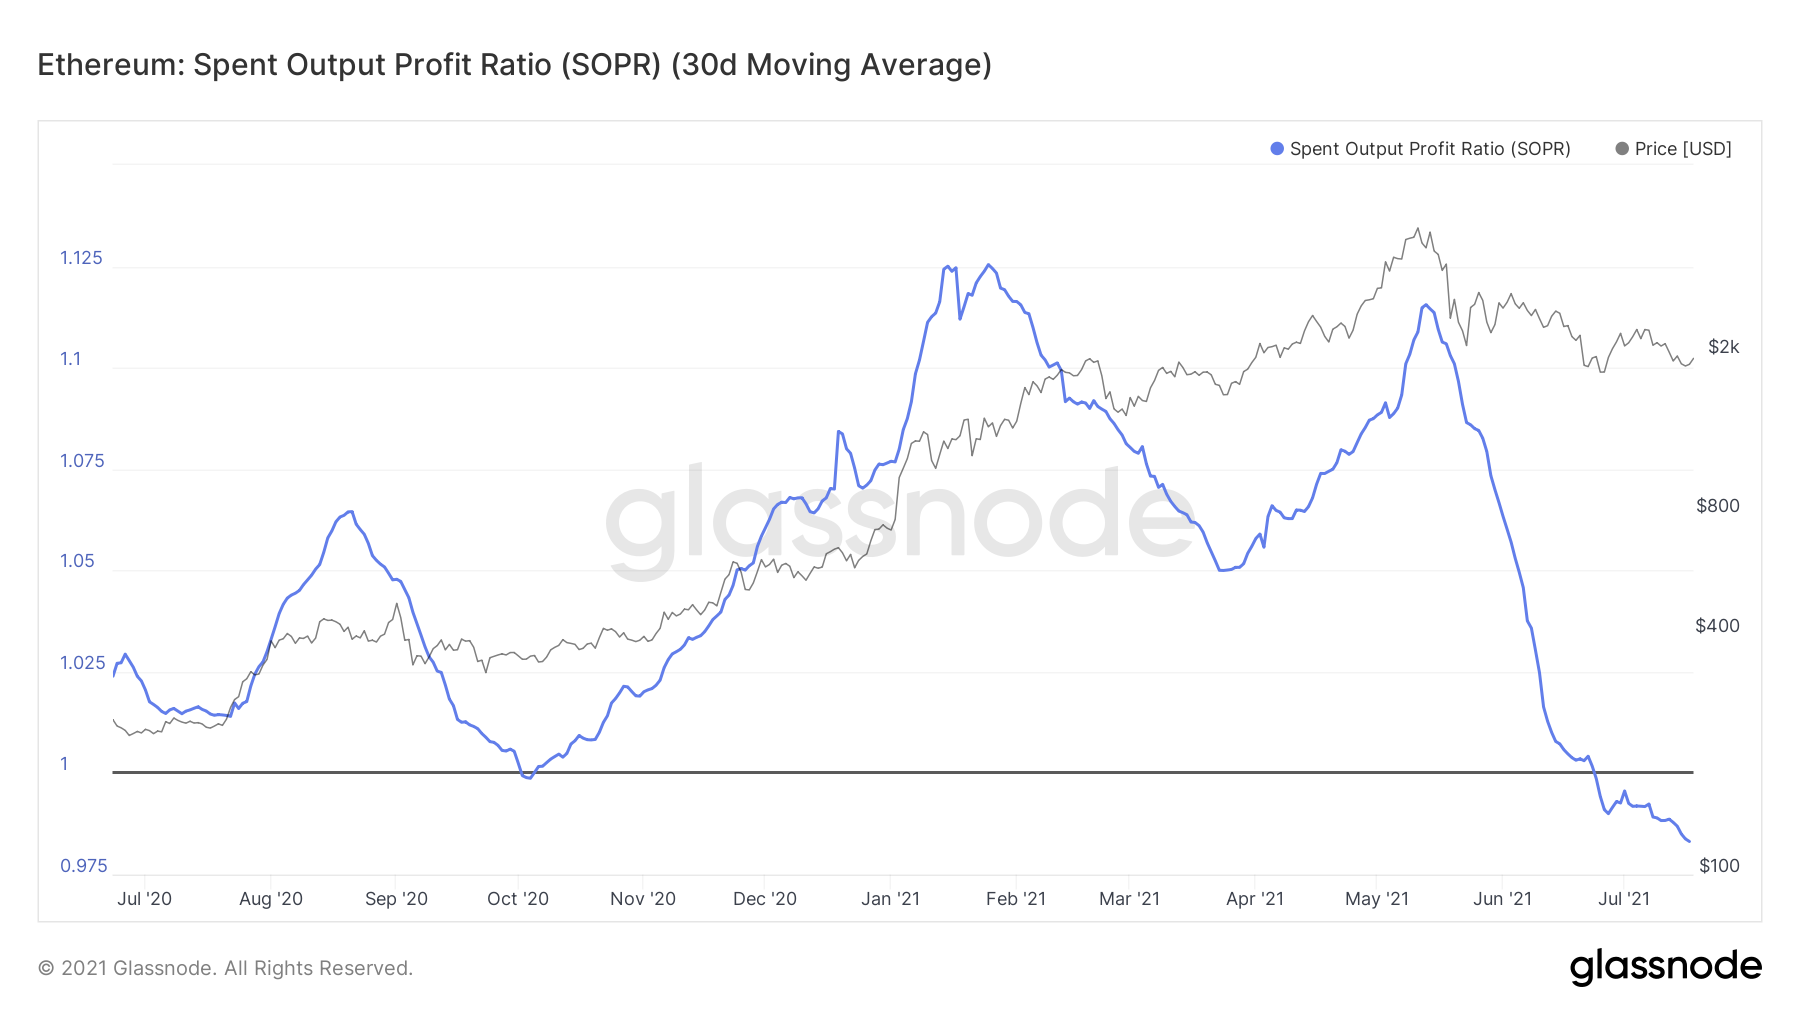
The first instances of this notion were observed on the Spend Output Profit Ratio (SOPR). This metric dictates the ratio of a coin’s realized value against the value it was at during its creation. When charted using a 30 day SMA, it reveals that the line under 0 represents losses in the market. This fall was the lowest this indicator has been in over a year and as of now, it continued to head downward.
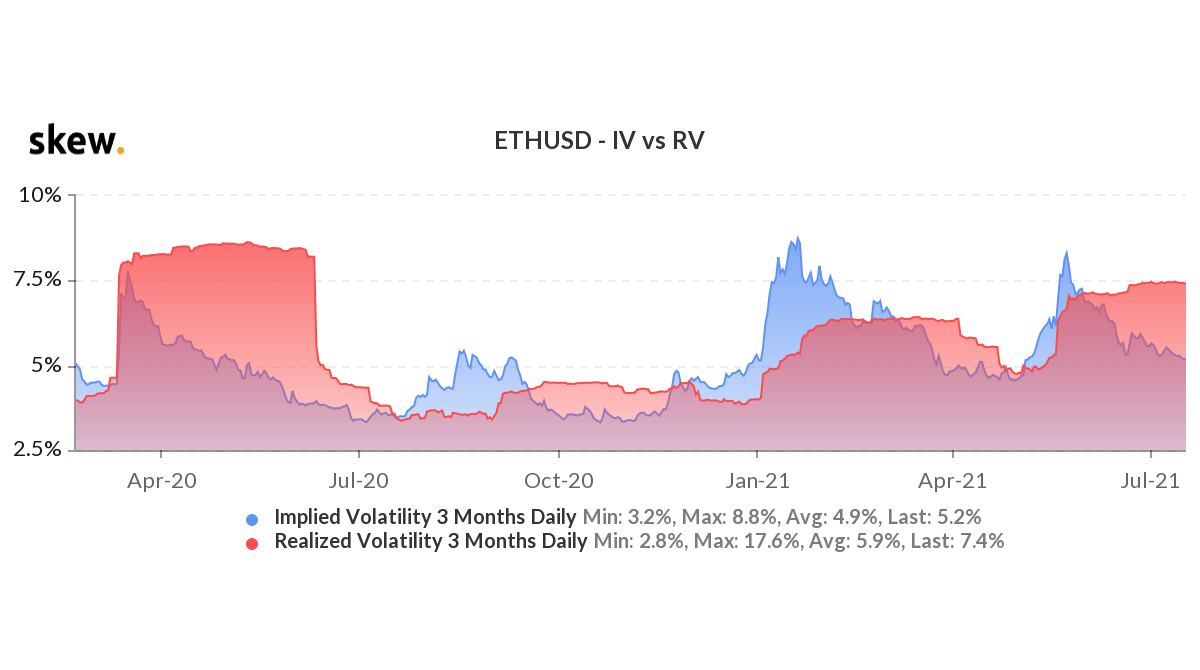
Secondly, on the IV vs RV ratio, Ethereum was terribly bearish. Historically, RV superseding IV bears a negative effect on the market. In this case, the metric has been in a bearish state since the beginning of June. In fact, the pace at which RV is rising, if not restrained, could reach the April 2020 Covid-19 crash levels.
Is this just a short-term downtrend?
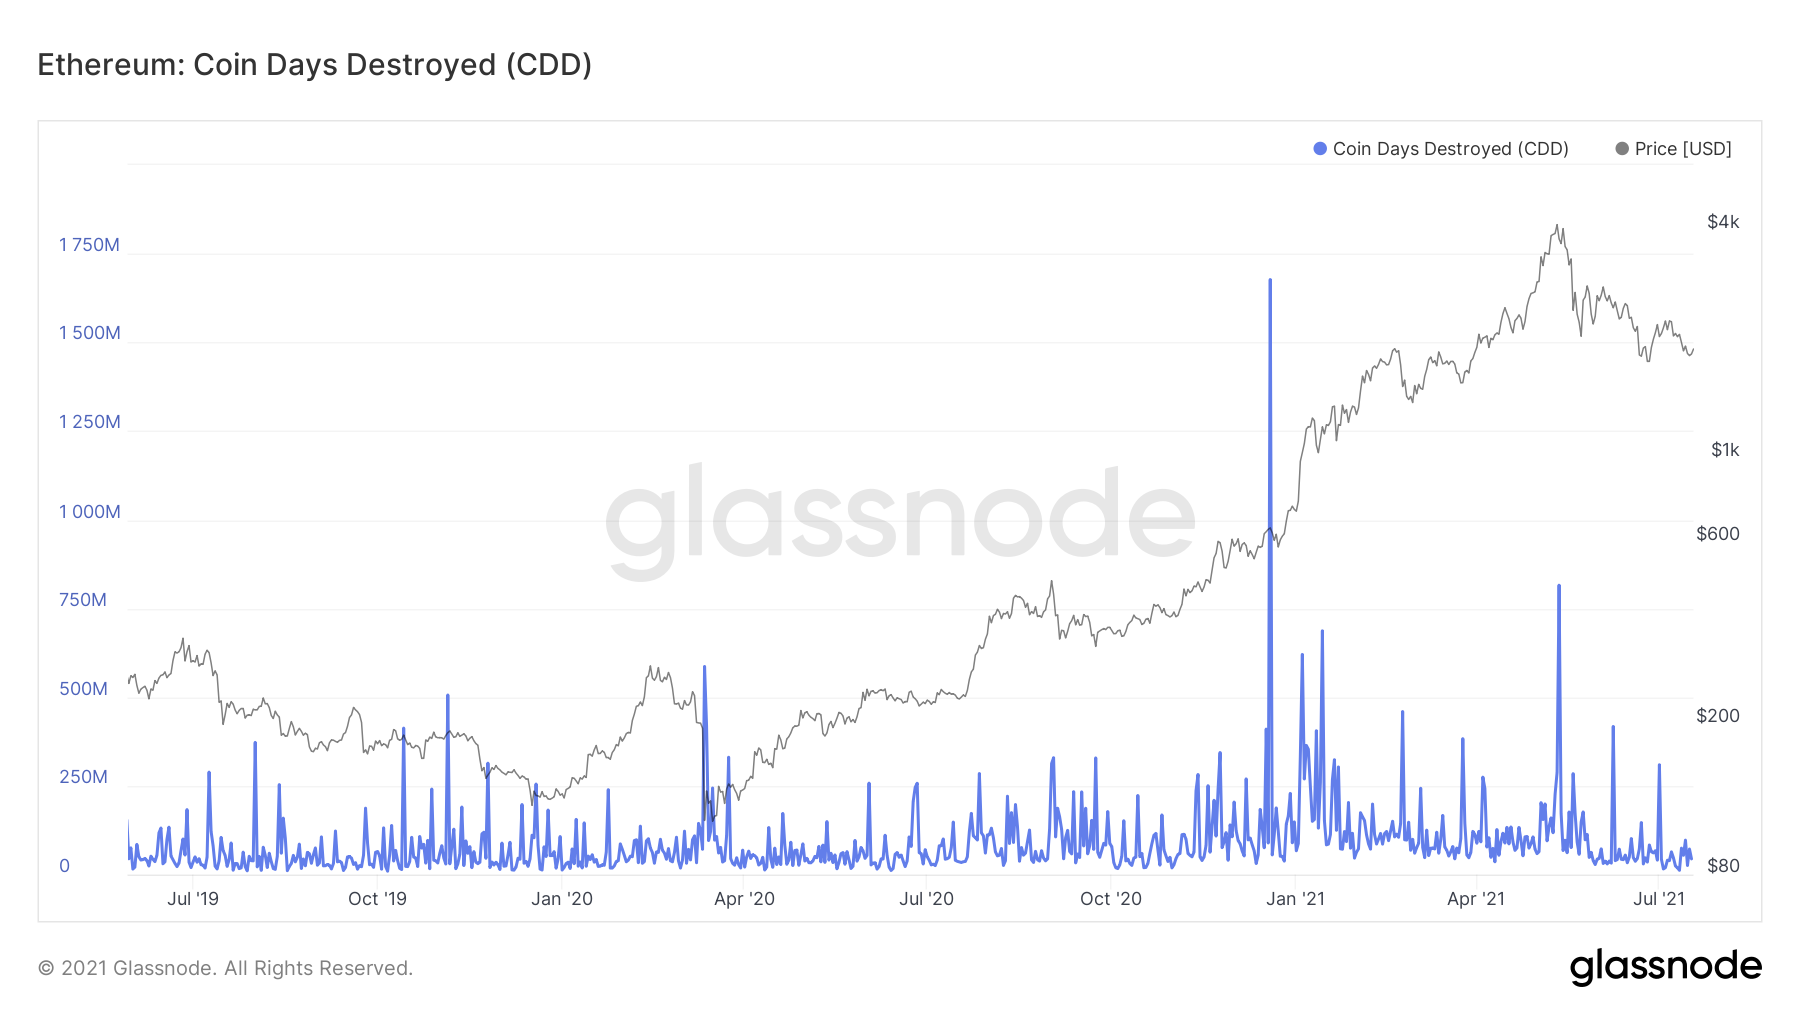
No. This behavior isn’t a simple short-term downtrend since other major on-chain metrics display positive signs across the board. Exchange net flow volumes and developer activity exhibit healthy market signals. Additionally, Coin Days Destroyed have been consistently low, which meant that no older coins were being sold. The trade was observed to be regular in nature, that is, the day-to-day trading volumes did not hint at any flick.
The change in investor sentiment primarily comes from the investors and the community itself. For Ethereum, Social Volumes have been falling for a while now. At the time of this report, these volumes had reached a 3-month low which showed how skeptical investors were.

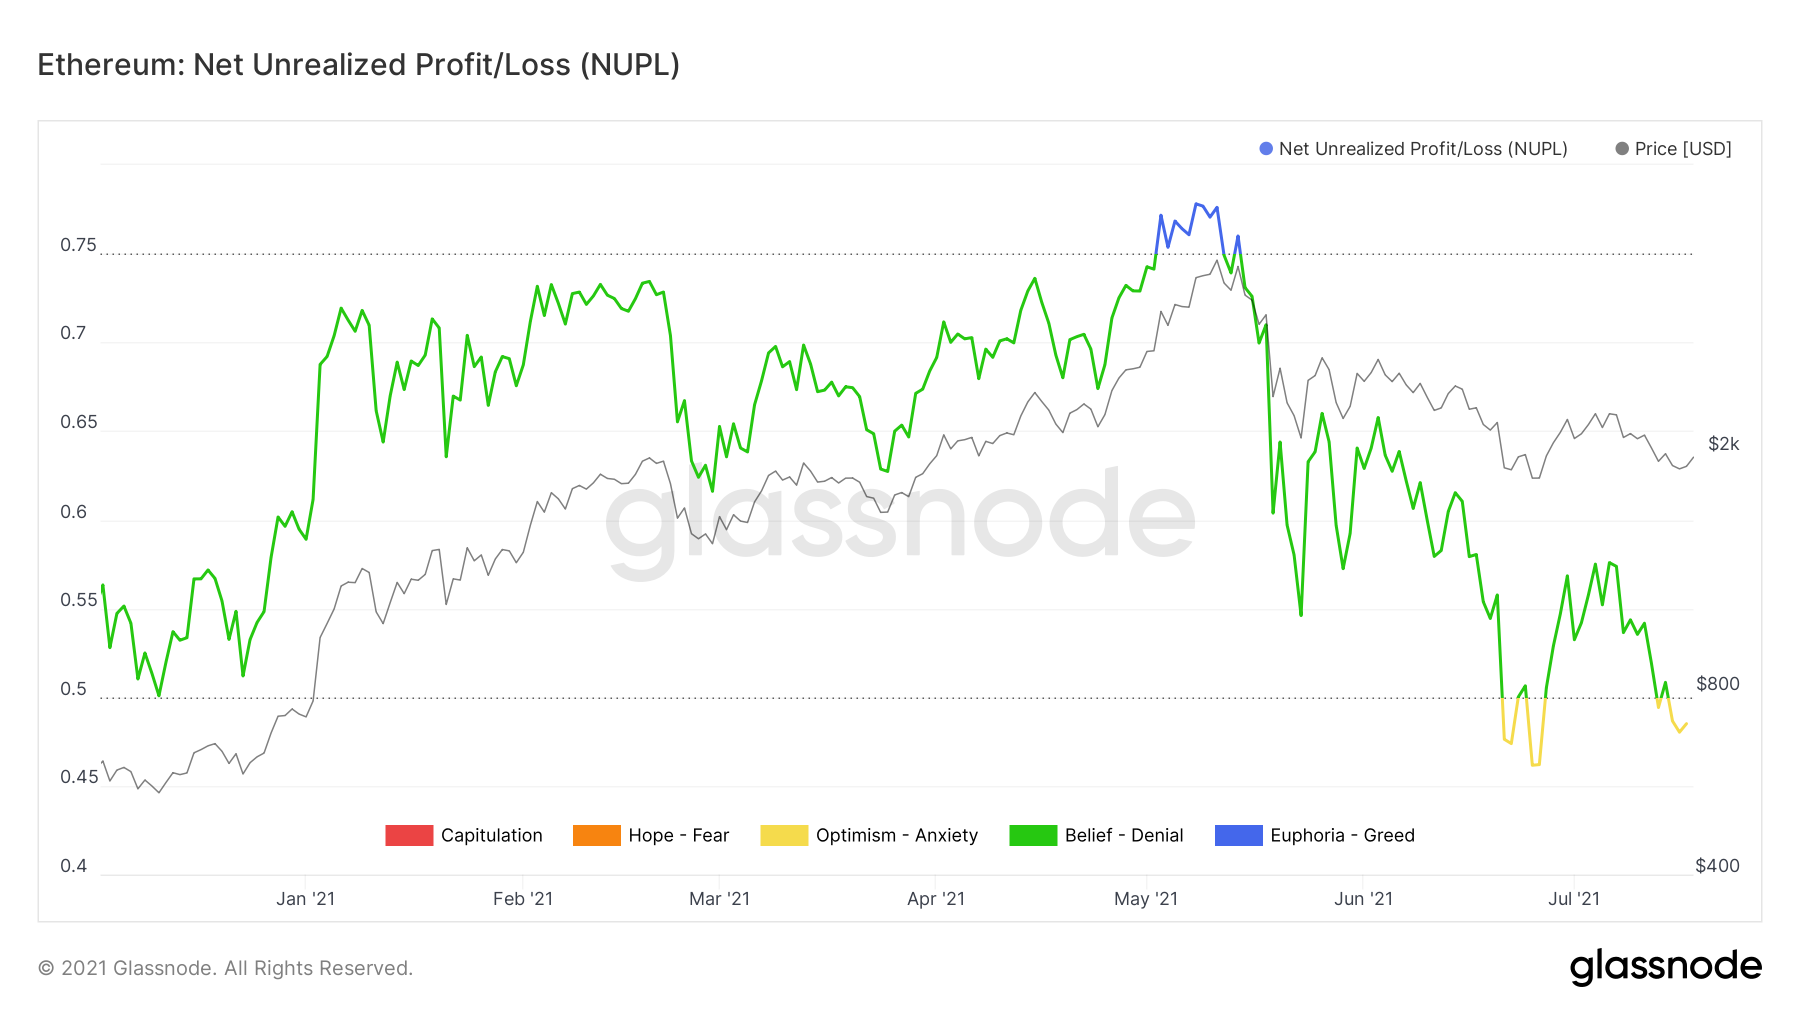
Lastly, a look at the NUPL chart displays the exact emotion the market is experiencing. The metric fell to its lowest this year, in June and at the moment, it was heading back there. Even though anxiety isn’t necessarily the worst sentiment for the market. It is, however, proof of where the investors stand.