These Moving Averages can help Shiba Inu traders determine their investment decisions

Gridlocked between the 20-SMA (red) and 200-SMA (green), Shiba Inu’s price was in a sensitive spot. On one end, an upwards breakout would see SHIB extend its value to the 38.2% Fibonacci level and on the other, a large sell-off would drag its price back to the lower trendline.
Shiba Inu 4-hour Chart
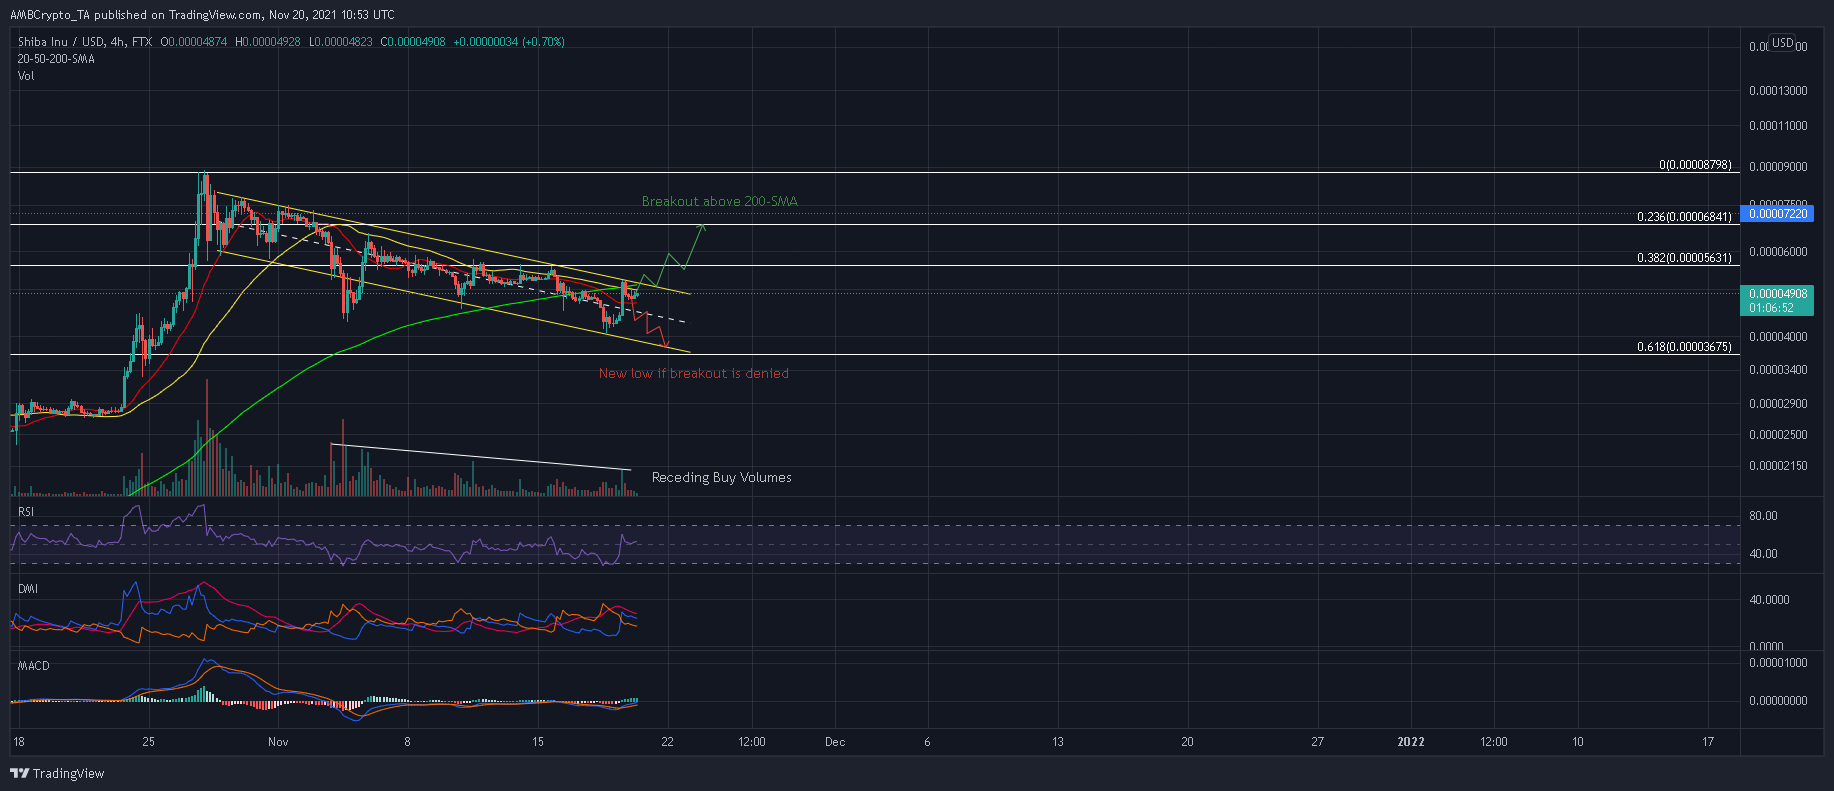
Shiba Inu was close to a descending channel breakout after a 10% surge over the last 24 hours.. Once the 50 and 200 SMA’s are flipped to bullish following an additional 6% rise, SHIB would carve a path to the 23.6% Fibonacci level. However, a closer look at the volumes suggested that buy numbers have been on a steady decline over the last three weeks.
Based on this development, SHIB lacked the strength to break away from its down-channel in order to fast-track its recovery to October highs. Moreover, if the 20-SMA (red) and mid-line is foregone, SHIB would look set to snap a new low at the bottom trendline around $0.00003944. The presence of the 61.8% Fibonacci level would help counteract an extended sell-off attempt.
Reasoning
Although SHIB’s indicators did give an edge to the bulls, further conviction was needed for an upwards breakout. For instance, the RSI was yet to charge into bullish territory while the MACD traded below its half-line.
Moreover, the Directional Movement Index looked to concede its bullish-bias after the -DI line edged towards the +DI line. These precarious signs did not sit favorably for those expecting a bullish near-term outlook.
Conclusion
SHIB traders are advised to wait for further developments before placing any bets in the market. An upwards breakout was a certainty given the lack of strong buy volumes and indecisive indicators.
For the moment, fears of a possible 15% decline to the lower trendline were also kept at bay by the 20-SMA (red) and mid-line of the pattern which functioned as support levels. Hence, a better call would be to short SHIB below its 20-SMA (red) and long SHIB above its 200-SMA (green).