These Solana metrics could give SOL investors a few sleepless nights because…

Solana Daily, a popular Twitter handle that posts about updates about the Solana [SOL] ecosystem, recently uploaded Solana’s latest weekly report. The report mentioned all the major developments on the network over the past week, including Solana’s integration with Google Cloud and the launch of Solana Mobile.
Solana Ecosystem Update (Week 44)
Take a look back what happens on Solana last week#SolanaDaily #Solana pic.twitter.com/c33lVAqXkO
— Solana Daily (@solana_daily) November 7, 2022
____________________________________________________________________________________________
Here’s AMBCrypto’s Price Prediction for Solana [SOL] for 2023-24
____________________________________________________________________________________________
Though these developments added much value to the Solana network, the last week could be considered as disastrous for SOL’s performance in terms of price action. According to CoinMarketCap, the coin registered over 20% negative weekly gains.
At the time of writing, SOL was trading at $26.05, with a market cap of over $9.4 billion. Another piece of bad news came in for SOL when it lost its spot on the list of the top 10 cryptos in terms of market capitalization. This was because Polygon [MATIC] flipped it.
All these red flags made SOL a hot topic in the crypto community, which was evident from CoinGecko’s data. SOL was on the list of cryptos that were trending on CoinGecko on 7 November.
⚡️Trending Searches by @CoinGecko
7 November 2022$FTT $APT $SOL $PROS $STG $GALA $MATIC $CHZ $DOGE $EMOS pic.twitter.com/cZi97tNeCT— CryptoDep (@Crypto_Dep) November 7, 2022
Darker days ahead for SOL
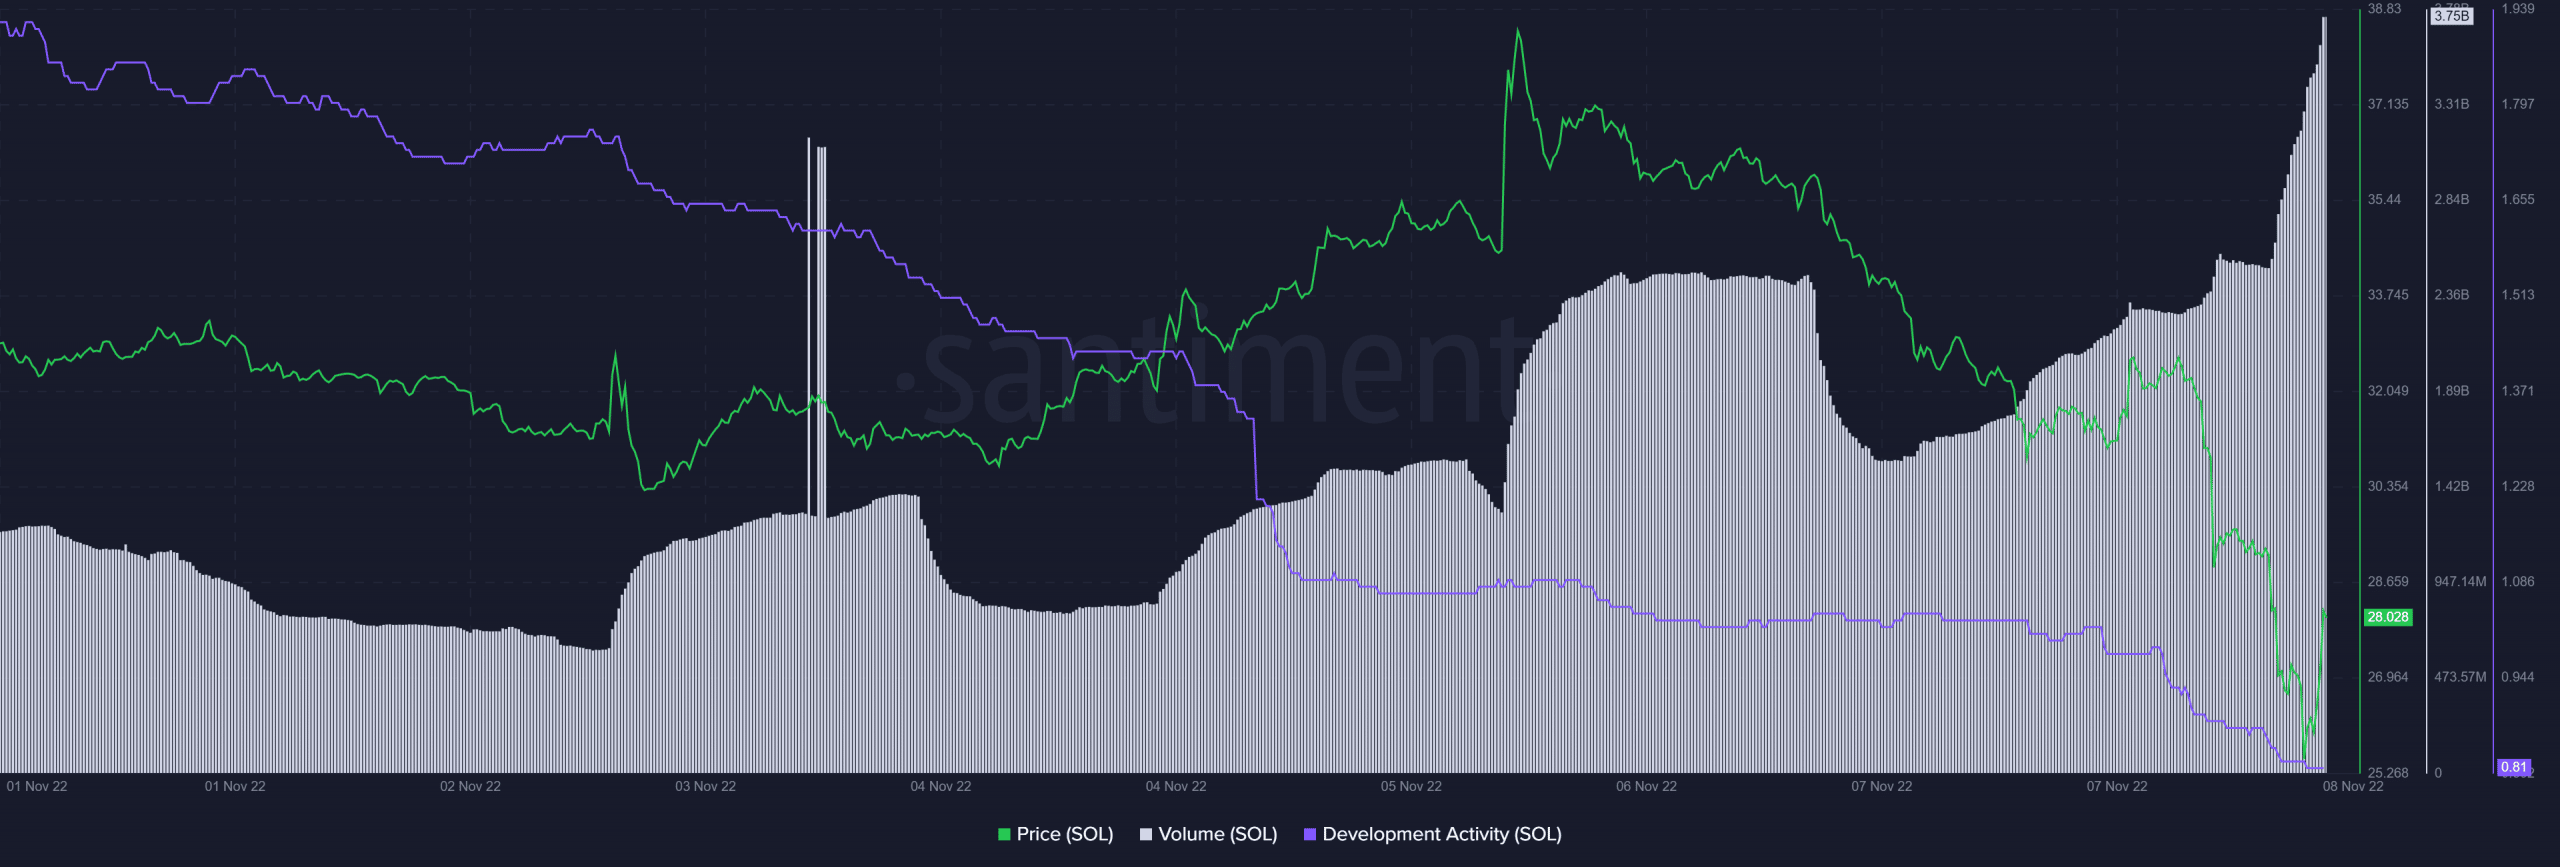
Despite the aforementioned updates, SOL’s development activity moved south. SOL’s volume, on the other hand, registered a sharp uptick while its price decreased. This was a negative signal as it legitimized the downtrend.
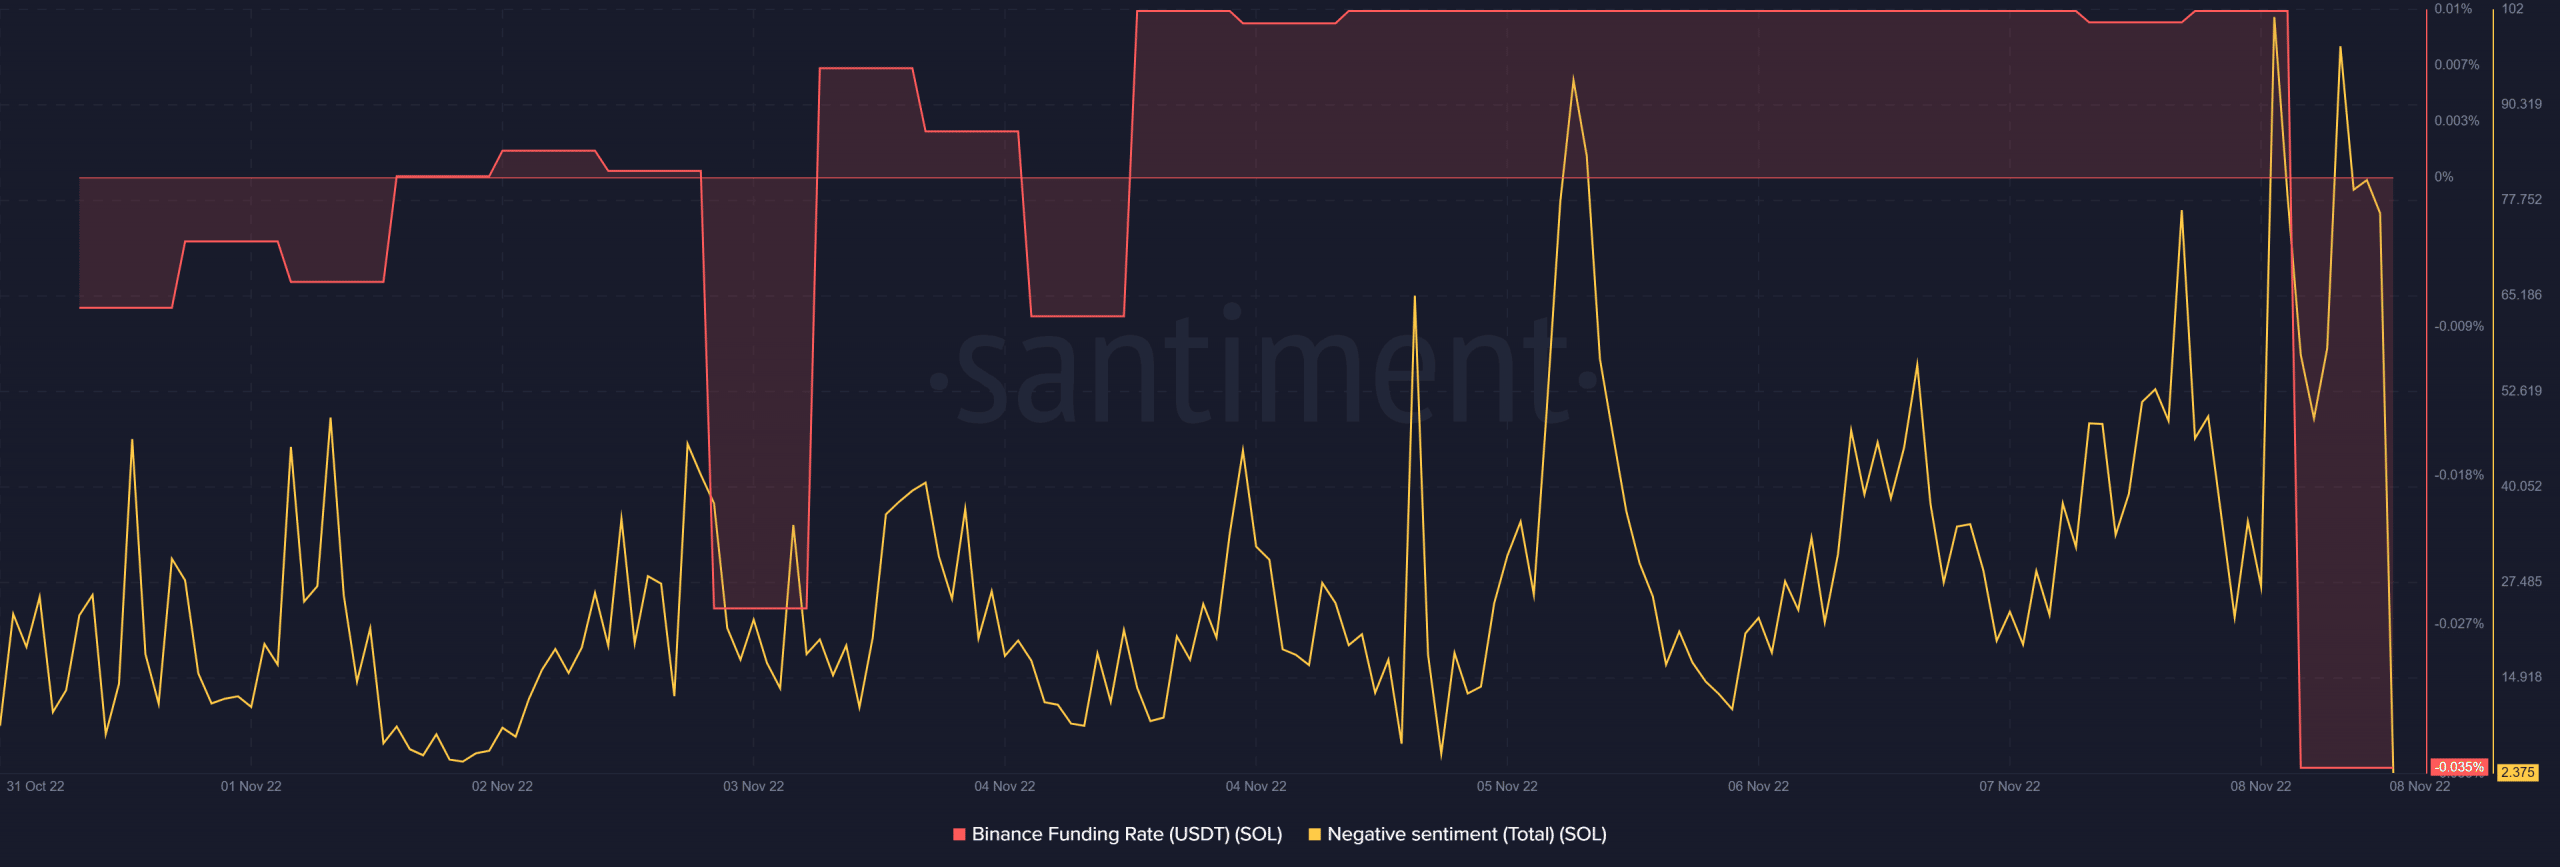
The coin also failed to gain interest from the derivatives market, as its Binance funding rate declined substantially. The crypto community was also not quite confident in SOL, which was evident looking at the decline in negative sentiment.
But be ready for a price decline
SOL’s daily chart revealed that investors could have a lot to worry about as a further price drop could be imminent over the next few days. The Exponential Moving Average (EMA) Ribbon displayed that the 20-day EMA was below the 55-day EMA, and the gap between them increased, which was a bearish signal.
Moreover, the Money Flow Index (MFI) registered a downtick, suggesting a price fall. The Bollinger Bands (BB) indicated that SOL’s price was in a high volatility zone, further increasing the possibility of a price plummet. Incidentally, though the Chaikin Money Flow (CMF) was resting way below the neutral mark, but registered a slight uptick, which might give some hope to investors.