
Theta projected dips at $12 and $11 and a fall below the latter level could lead to further losses in the market. EOS’ correction could see it drop all the way towards the 23.6% Fibonacci level at $6.4. Lastly, Tron’s breakout was restricted at $0.165 and $0.148 needed to be defended from some selling pressure.
Theta [THETA]
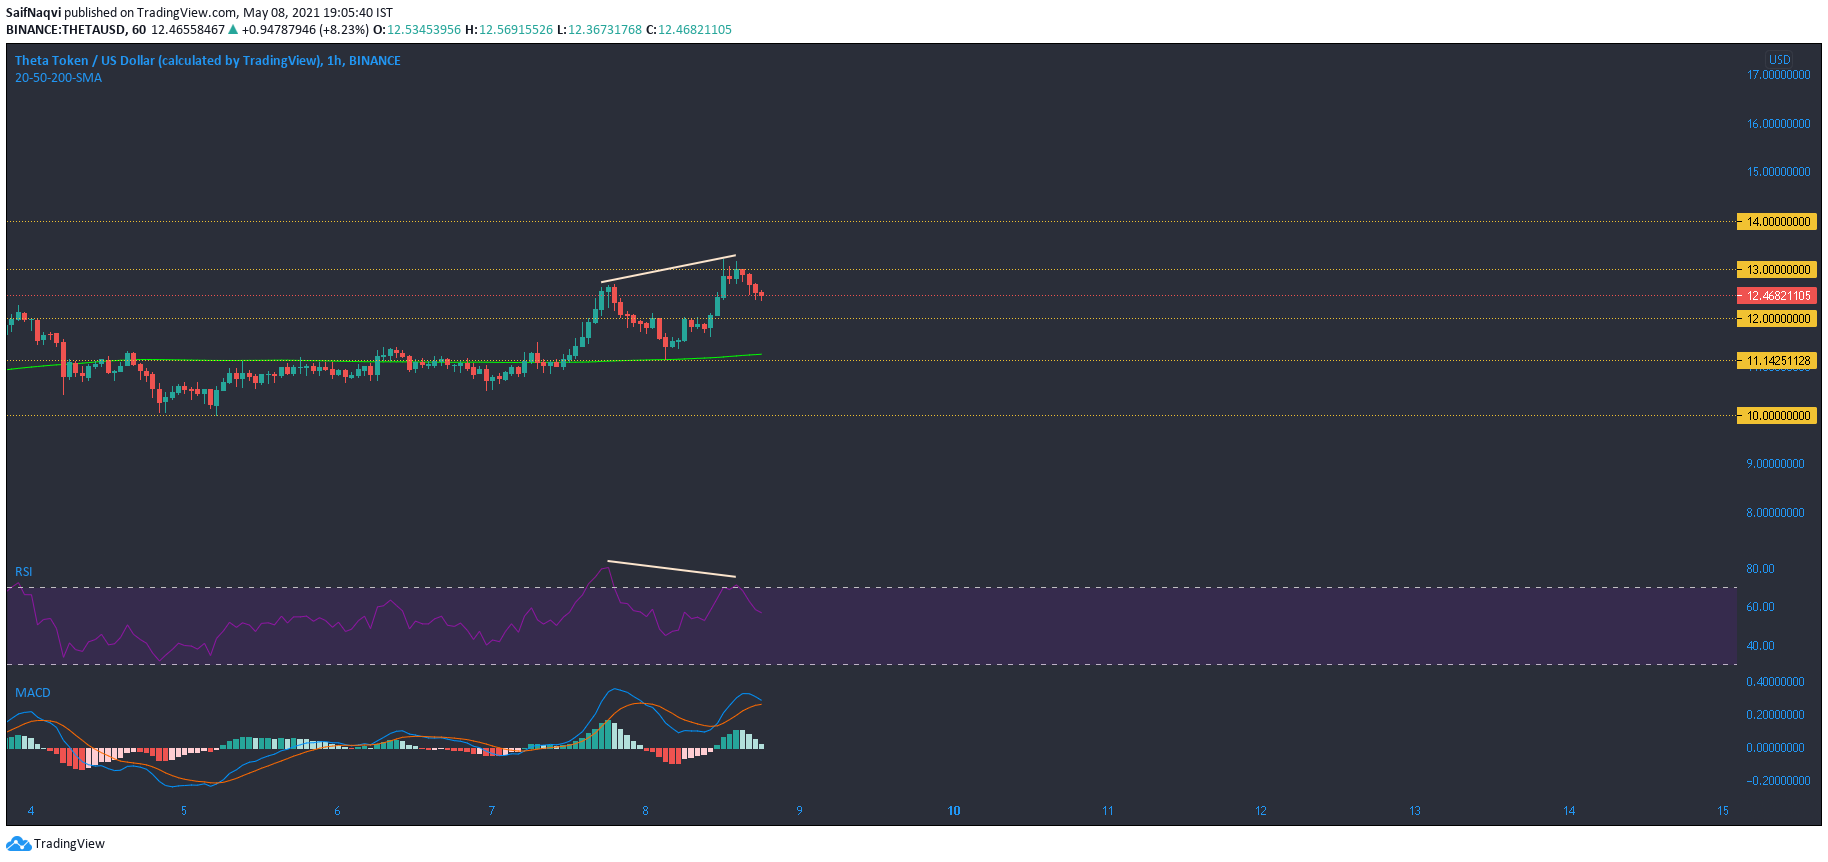
Source: THETA/USD, TradingView
The hourly timeframe captured Theta’s bearish movement after the price touched $13. This was within expectations as a previous analysis mentioned limited gains despite a break above $12. RSI even highlighted a bearish divergence and the recently turned $12-mark would be under the spotlight over the coming hours.
Relinquishing the $11-mark to the bears would even drop THETA below its 200-SMA and lead to an extended bear market. MACD line inched closer to the Signal line and presented the threat of a bearish crossover. For a bullish outcome, levels to overturn include $14 and $15.
EOS
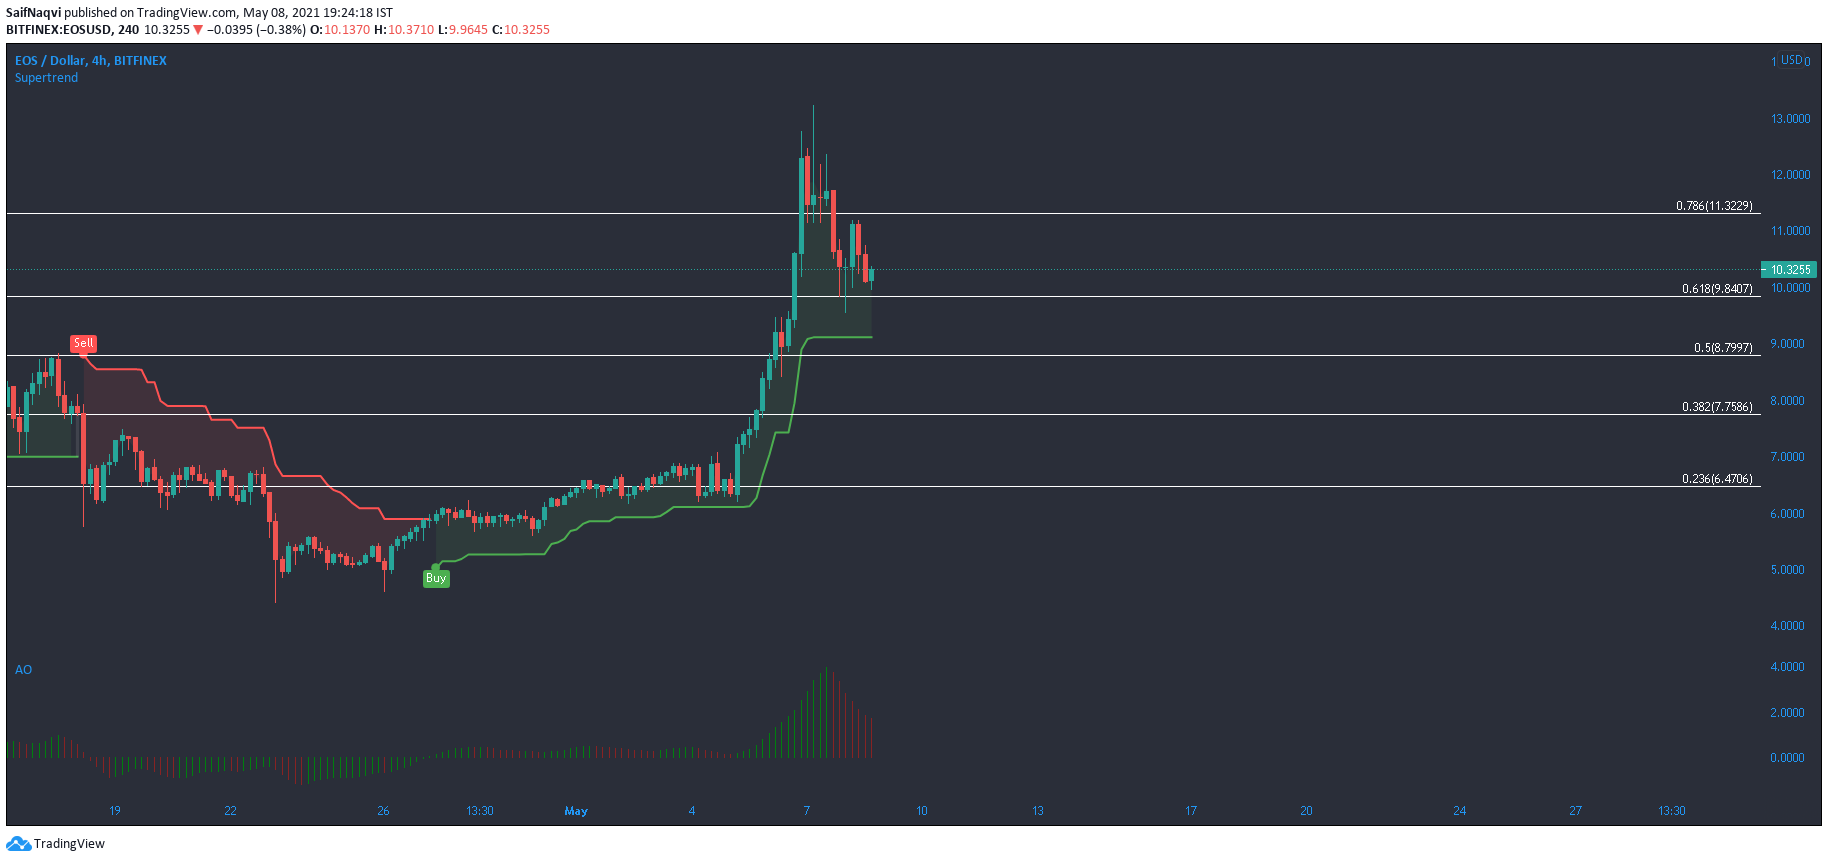
Source: EOS/USD, TradingView
The last few days saw a sharp surge in EOS market as its value appreciated from a low of $4.4 to a high of $12.4. However, a correctional phase over the last 24 hours saw EOS fall below multiple support levels on the 4-hour timeframe. Using the Fibonacci tool, a few retracement levels were highlighted. Prominent areas of support rested at the 50% ($8.8), 38.2% ($7.7) and 23.6% ($6.4-$6.2) Fibonacci levels.
Awesome Oscillator noted a series of red bars as momentum grew stronger on the selling side. Supertrend Indicator would switch to sell below the $9-mark and a viable take-profit could be set at $7.8 for short trades.
Tron [TRX]
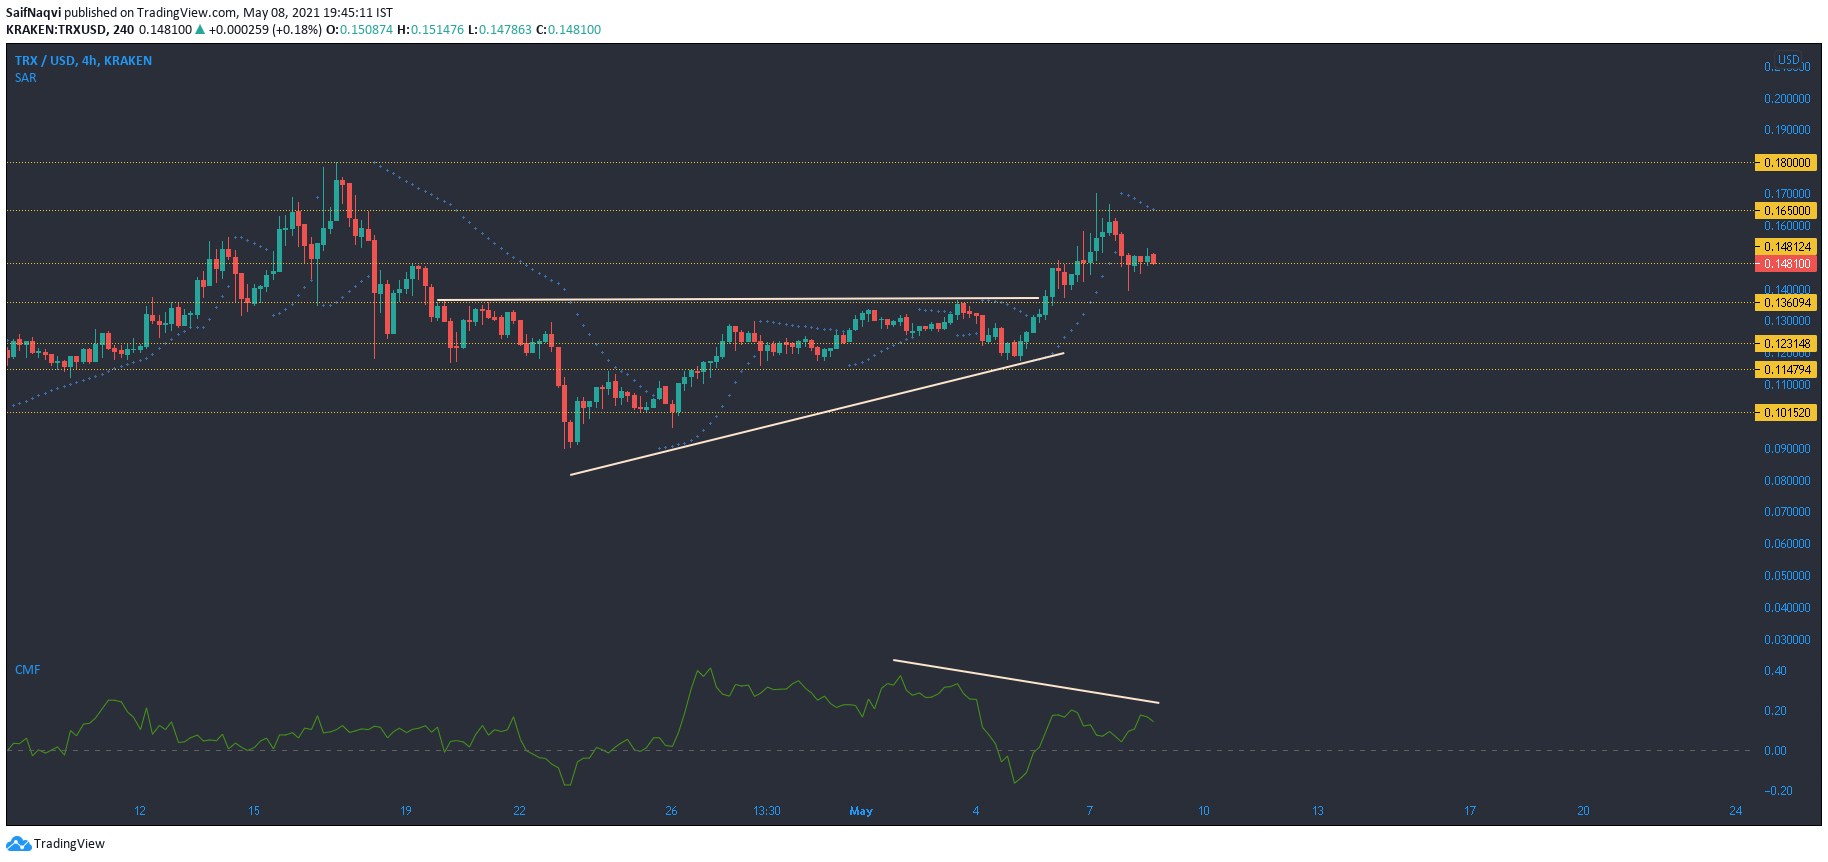
Source: TRX/USD, TradingView
While Tron did reclaim the $0.148 level from the bears, gains were restricted at $0.165 upper ceiling. In fact, the 4-hour timeframe showed an ascending triangle breakout and gains above the upper trendline amounted to nearly 17%. However, a bearish trend could see TRX head back towards $0.136. A 40% fall in the 24-hour trading volumes showed trading inactivity and the threat of a breakdown loomed large.
A dip below $0.129 (coincides with 200-SMA) could also lead to an extended sell-off. While Chaikin Money Flow has maintained above the half-line, lower highs suggested a weakening trend. Capital outflows would only accentuate losses in the market. The Parabolic SAR’s dotted markers moved above the candlesticks and highlighted a downtrend after TRX snapped $1.65.