THETA has traded within a range in the past month, watch out for these levels

Disclaimer: The findings of the following analysis are the sole opinions of the writer and should not be considered investment advice.
USDT Dominance and Bitcoin Dominance have been rising over the past two weeks, which meant two things. Firstly, crypto investors are fleeing to the stablecoin USDT. Secondly, the altcoin market has been shedding value faster than Bitcoin has. The bear trend has affected THETA as well, as Theta Network’s token has steadily slid down the charts in the past two months.
THETA- 1 Day Chart
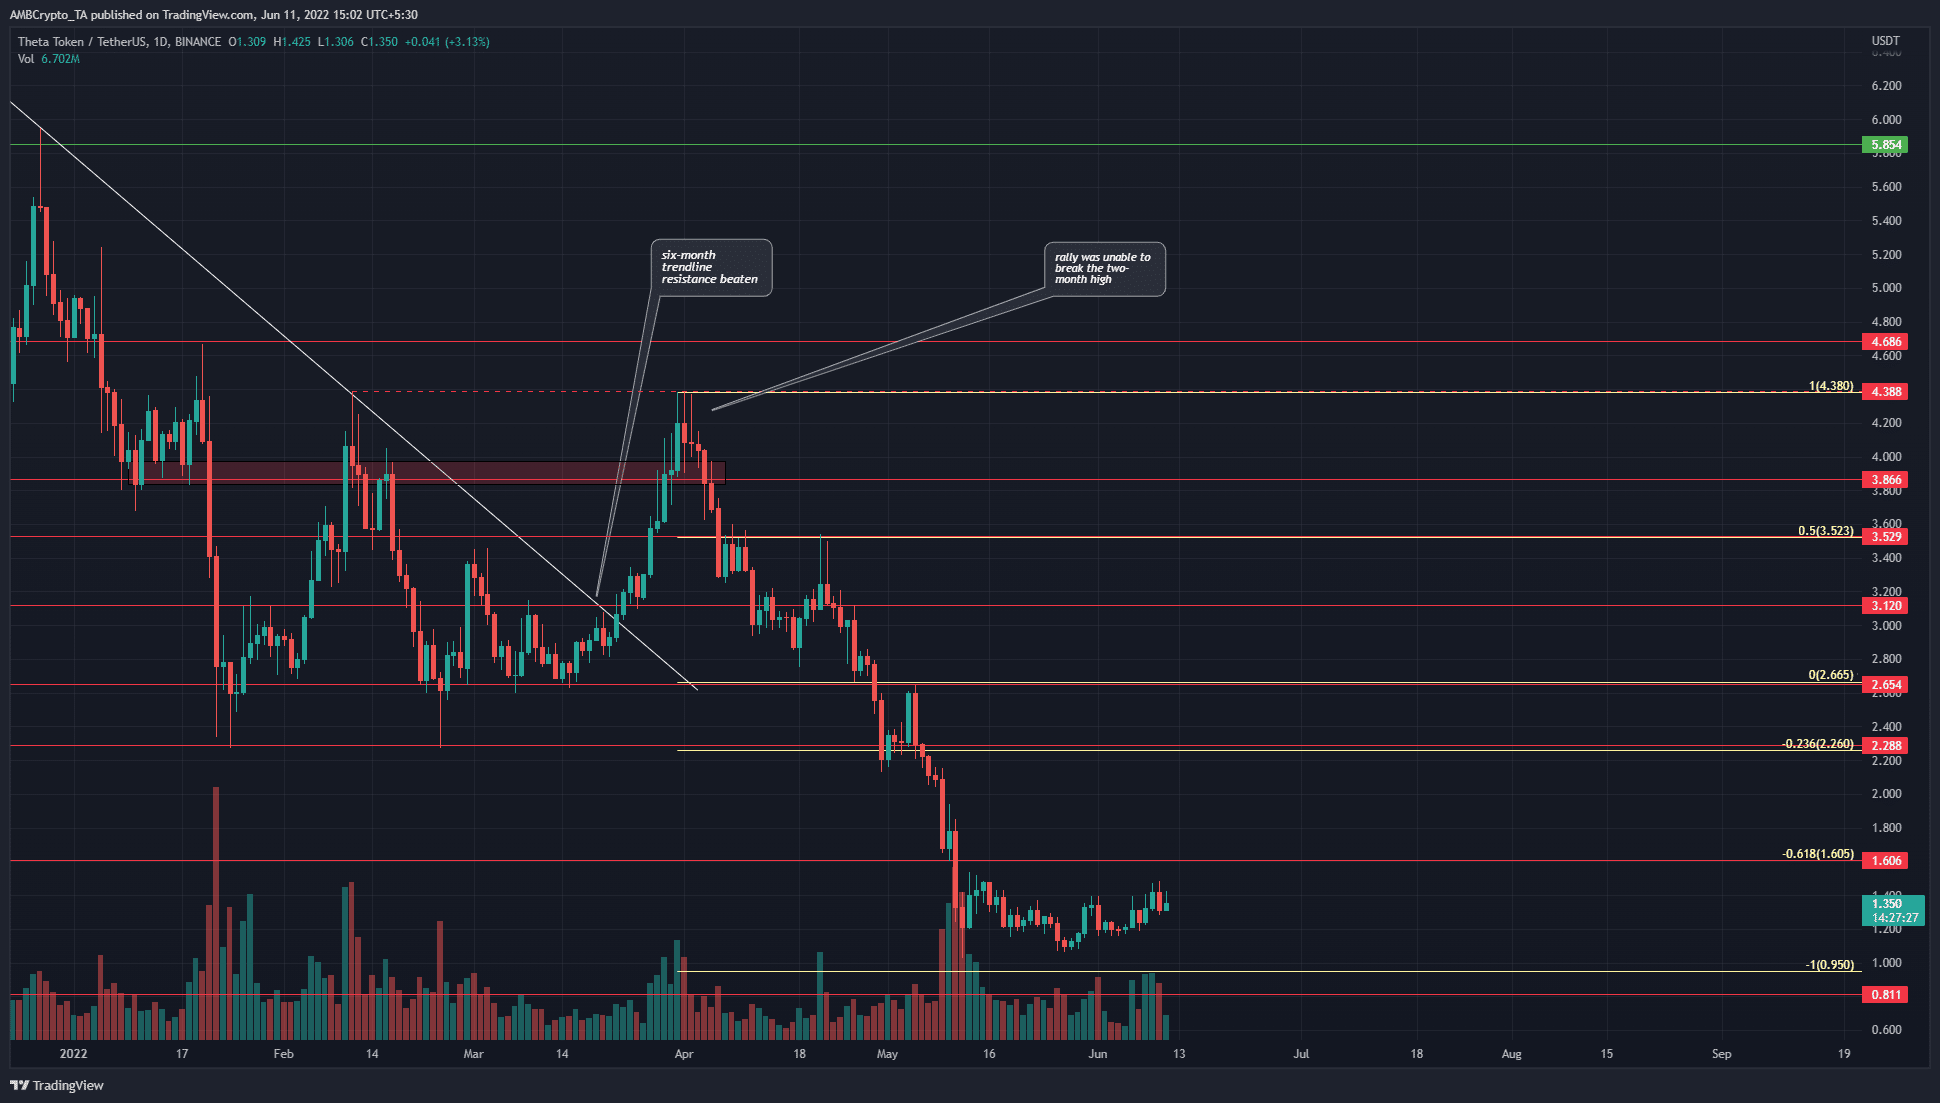
The trend has been firmly bearish since early April. In fact, the price has been trending lower since early September. In the mid-March rally, a six-month-long trendline resistance (white) was broken, and the price returned to the February highs at $4.38. However, it was unable to break above this level and shift the longer-term trend to bullish.
Throughout April and part of May, there was violent selling pressure behind THETA which saw the token shed 77% in the span of 40 days.
Since 12 May, the price has stayed within the $1.2-$1.48 levels, with a solitary foray to $1.068. Hence, in the coming days, these are the levels to watch. A move past these levels would likely shed light on the direction of the next move for THETA.
Rationale
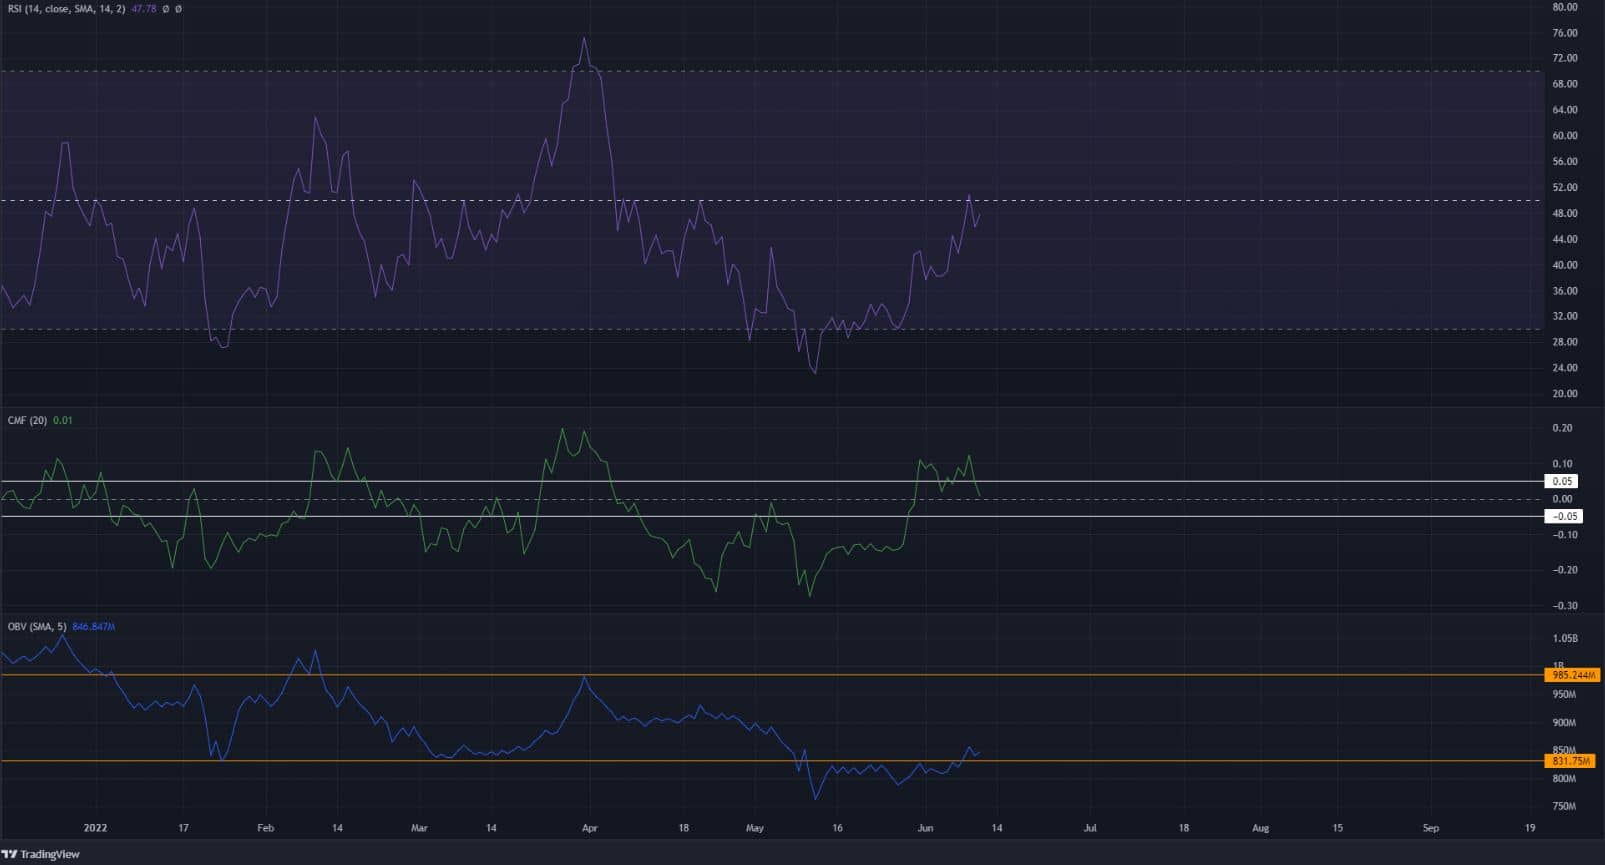
The RSI reached the neutral 50 mark, but has faced resistance there in the past couple of days, as well as back in April. If the RSI manages to flip the 50 level to support, it could signify a move toward the $1.6 resistance level.
The CMF has been below -0.05 for most of the past two months, but at the time of writing, had managed to poke its head back above +0.05. This showed that selling pressure had been dominant until the past two weeks.
The OBV had also managed to climb past a level that has been significant since mid-January, and this could be a sign of bullish intent.
Conclusion
The technical indicators showed that a move upward could be possible for THETA. However, its market structure remains bearish, and buying opportunities exist only for shorter-term traders and not long-term investors at the time of writing.


