This awaits Bitcoin if its price fails to topple the daily 200-SMA
Disclaimer: The findings of the following analysis are the sole opinions of the writer and should not be taken as investment advice
Bitcoin has been on a wild run lately.
Consider its performance from 21 July, for instance. 10 straight green candles followed by 5 red candles were observed on the cryptocurrency’s daily chart. The formation of ‘three black crows’ during this retracement flashed signs of a sharper pullback, but a bullish response at BTC’s 38.2% Fib level allowed the king coin to continue its journey north.
At the time of writing, the final test lay at BTC’s daily 200-SMA. However, faltering here would mean an incoming pullback.
Bitcoin was trading around the $43,700-level, at the time, up by 5.8% in 24 hours.
Bitcoin 4-hour chart
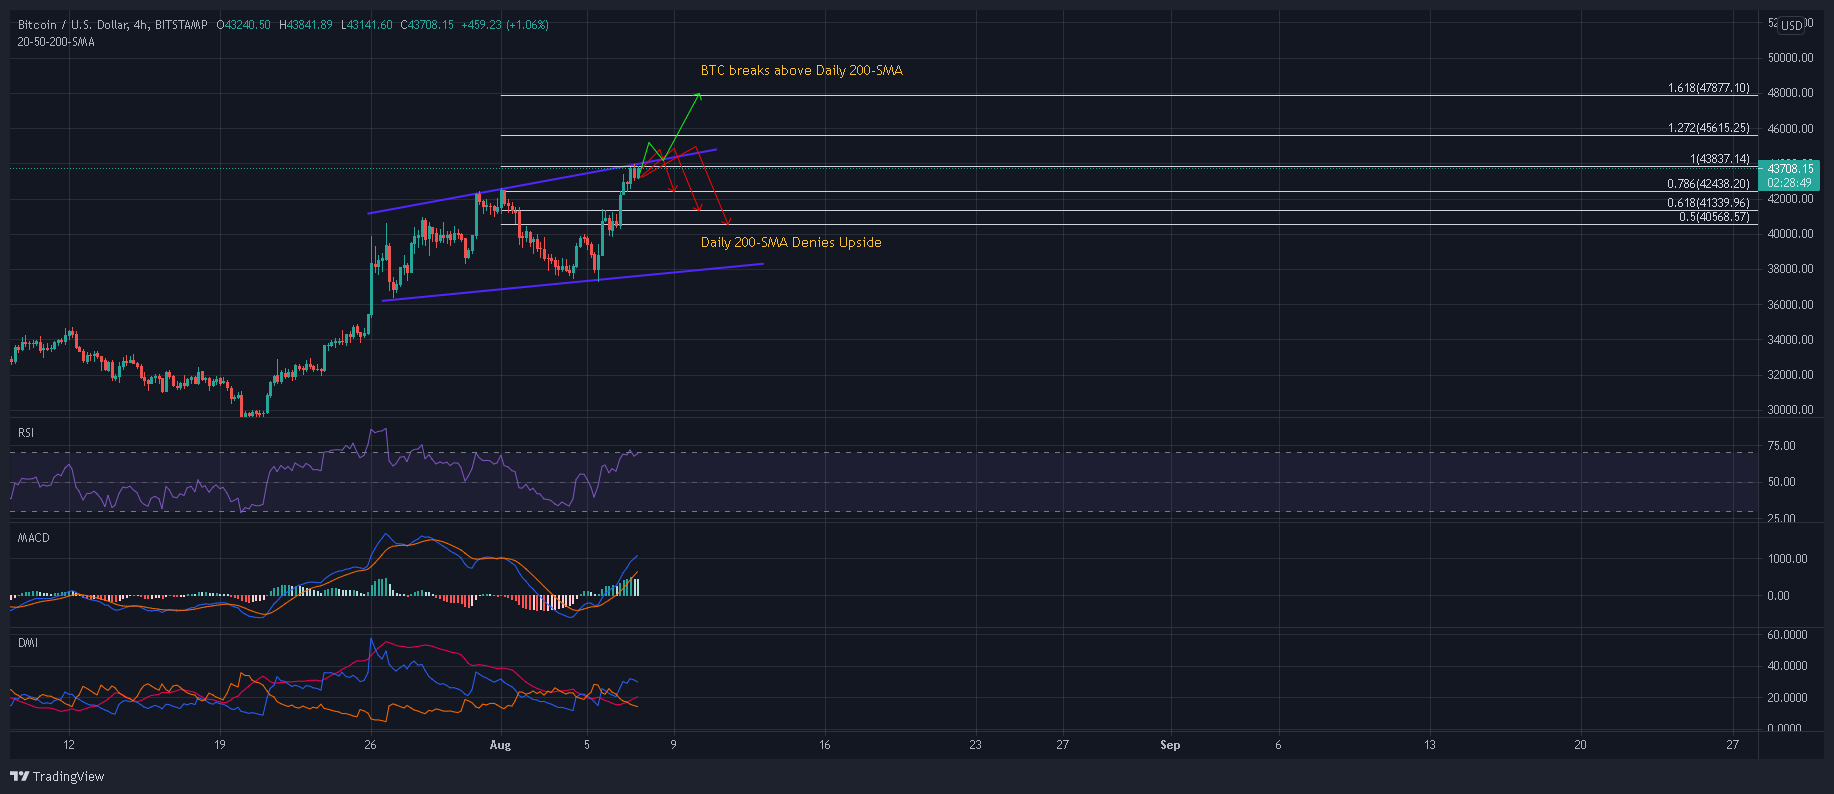
Since late July, Bitcoin has formed higher peaks and lows on its 4-hour chart. Each of these, in turn, has birthed a broadening wedge pattern. The highest and lowest points in the pattern were used to plot out a few Fibonacci Extension levels which presented the next target for BTC’s rally.
A close above the 100% Fibonacci Extension would also result in a breakout from the pattern. From the same, levels such as $45,615 and $47,877 can be realized. However, the daily 200-SMA (not shown) lay just under the $45k mark and could limit any further upside. When the next wave of selling pressure hits the market, the 61.8%, 50%, and 38.2% Fibonacci levels will be called into action.
Reasoning
The DMI’s +DI maintained itself above the -DI as BTC’s uptrend remained intact. The RSI’s higher highs pointed to bullish strengthening, but a hike into overbought territory did call for stabilization.
It remains to be seen how sellers respond (if at all), but a decline below 50 would mark a downtrend. While the MACD maintained its move above the half-line, its histogram noted some declining momentum.
Conclusion
Buyers had the upper hand in the Bitcoin market, at press time, but there were signs of declining momentum. Especially as BTC approached its daily 200-SMA present at $44,800. If this MA halts BTC’s movement, the 78.6%, 61.8%, and 50% Fib levels would come into play.
On the other hand, a favorable outcome would mean $45,615 and $47,877 for the cryptocurrency.