Why investors are playing it safe despite Bitcoin’s multi-month high

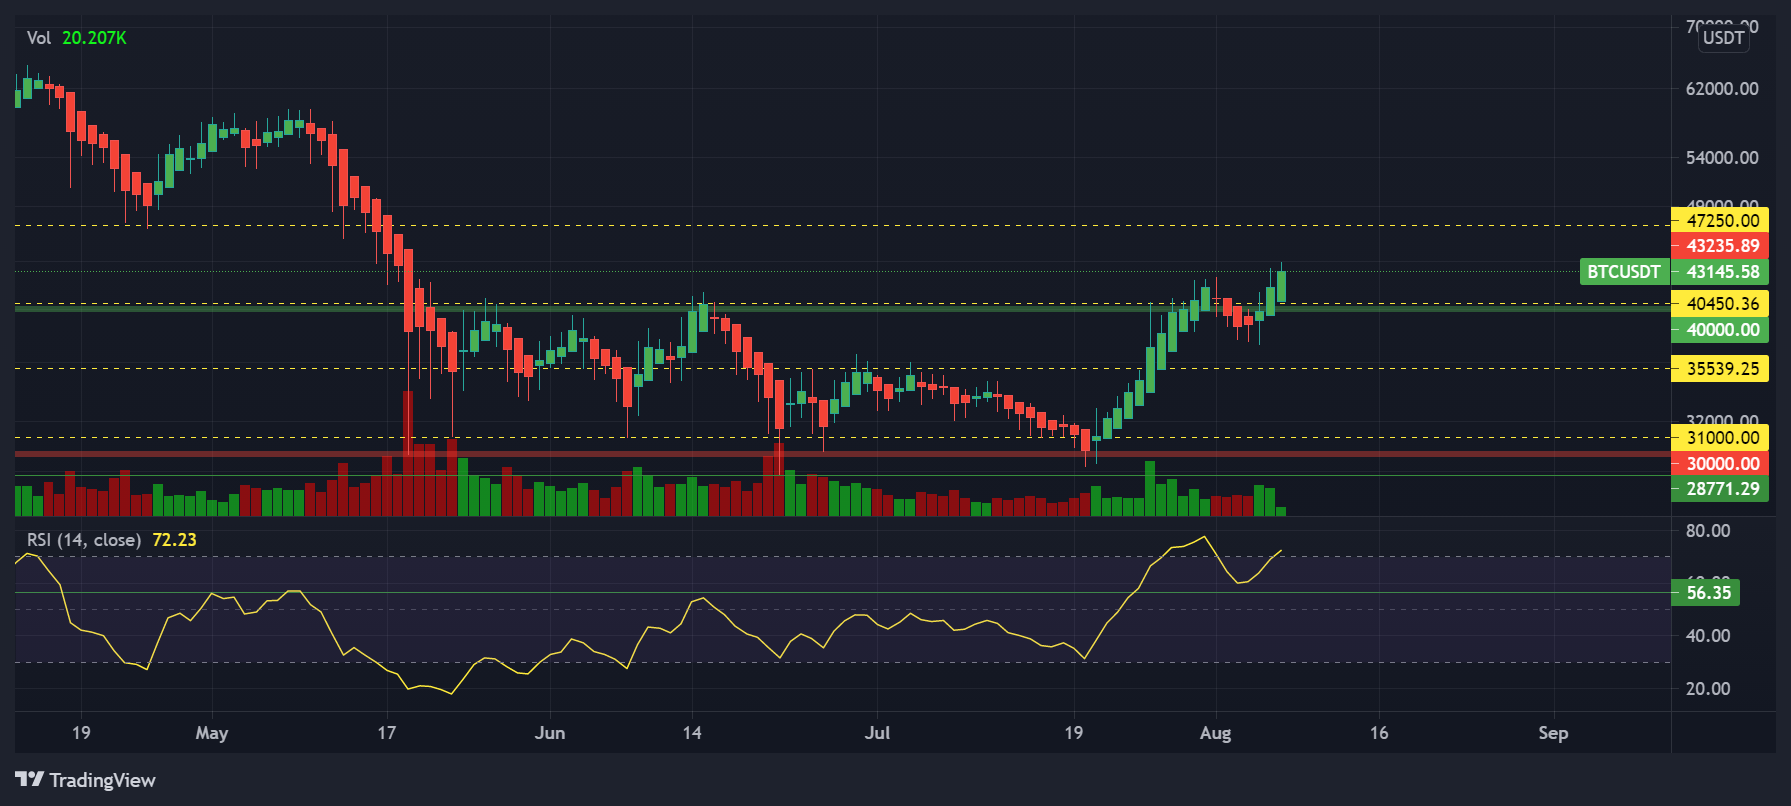
Bitcoin’s price rallied to a multi-month high of $43,930 on 7 August. The timing of the same was interesting, especially since Bitcoin closed in the red for three consecutive days before 4 August. In fact, many viewed this move as a final break away from the trading range the king coin has been stuck within since May.
After trading sideways through the early hours on 6 August, the market’s bulls came into action and pushed BTC to the aforementioned high. $43,930 is also BTC’s highest price point since 19 May 2021.
And yet, despite all the bullishness in price, trade volumes didn’t sky-rocket as they should have. This is a curious finding, especially since the Relative Strength Index reversed course on the crypto’s one-day chart. At press time, the RSI for Bitcoin was in the overbought zone and registered a reading of 72.8.
All through last week, analysts anticipated a rally because indicators like the crossover between two moving averages that last appeared before the 2020 bull run flashed bullish signals again. However, despite the rise in prices, market activity didn’t share the same excitement. Here’s why –
More Money, Less Activity
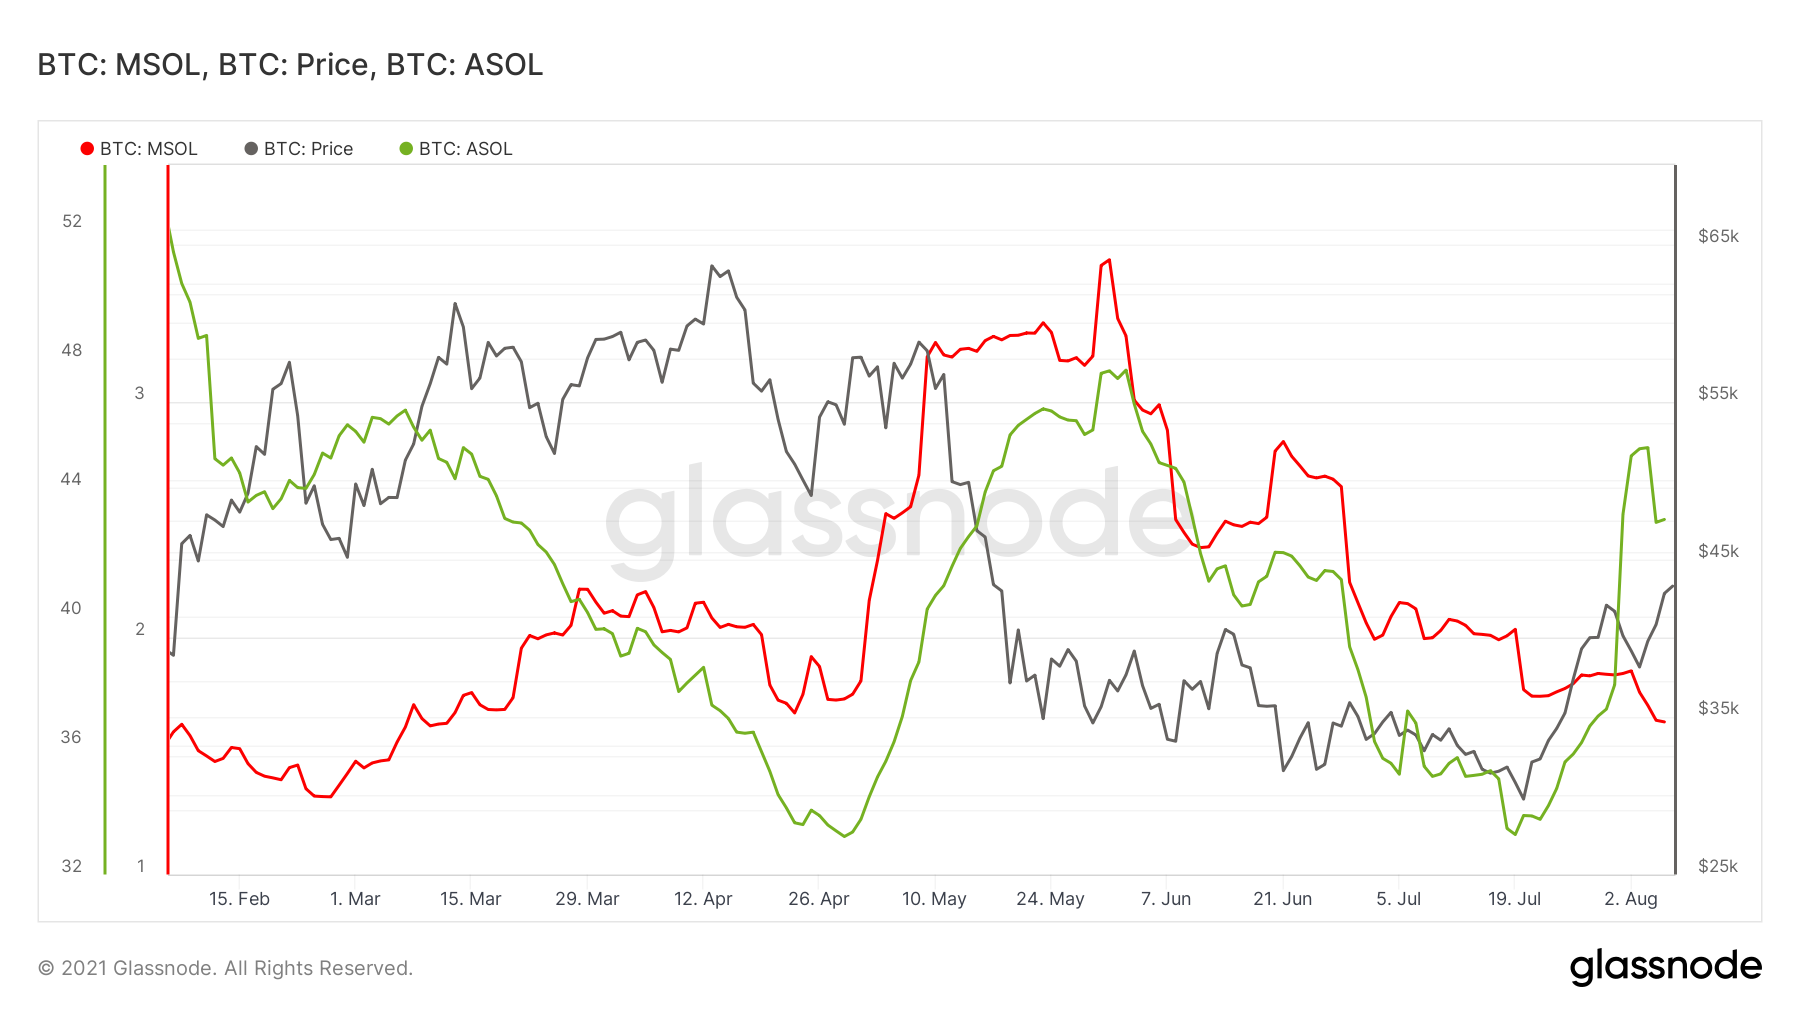
On the 30-day moving averages chart, the MSOL for BTC saw a massive downfall. At the time of writing, the extremely low value of MSOL was equivalent to its 11 March levels. This was indicative of more day-to-day traffic comprised mainly of young coins being spent, often associated with traders and short-term holders.
On the contrary, the ASOL hit a two-month high on 4 August (Such a high value was last seen on 5 June). This seemed to suggest that on that day, a greater proportion of network traffic were older coins being spent. This may also imply that long-term holders took advantage of high market volatility on that day. Even so, the ASOL too registered an immediate downtick over the next few days.
Will the price rally further?
These MSOL and ASOL values were indicative of more day-to-day traffic. However, active addresses for Bitcoin noted no recent peaks which, on the contrary, meant that daily activity was low.
Now, this could mean that investors have been playing it safe as Bitcoin’s price went up. They may be waiting to see if the price actually stabilizes or hikes even higher up the charts.
The second argument might be more reasonable here, especially after observing Bitcoin’s Implied volatility v. Realized volatility charts.
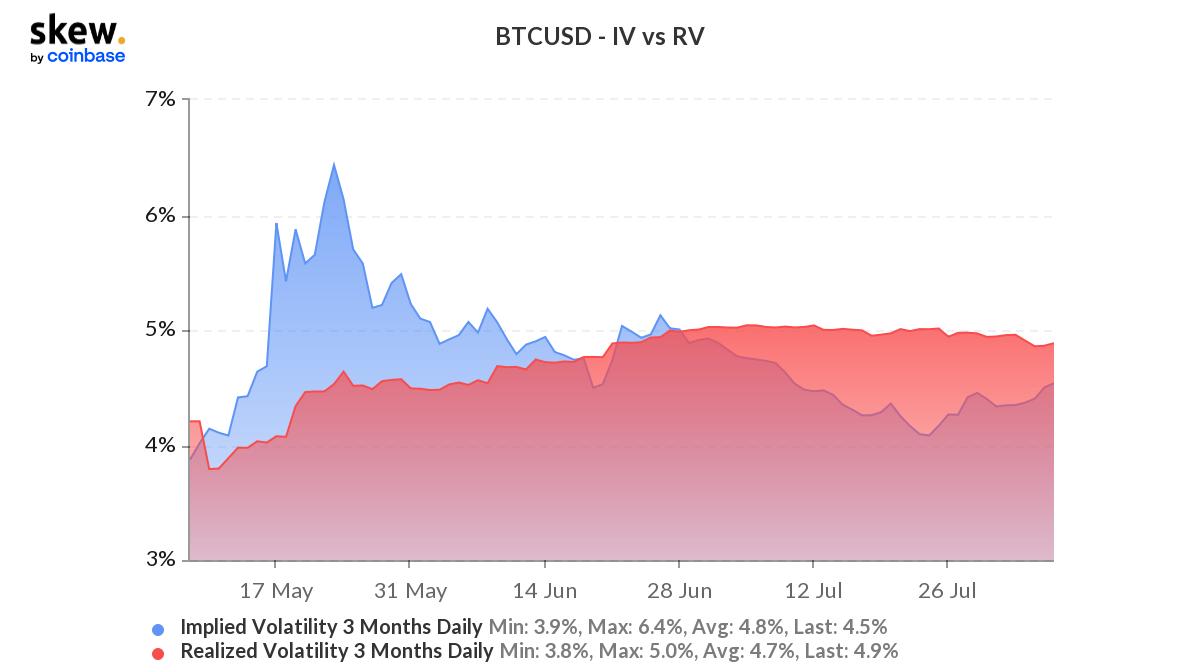
Noticeably, BTC’s difference in IV v. RV was the lowest in a month – Not a surprise in light of its price high. However, the last time these price levels were seen, the implied volatility was greater than realized volatility by quite a margin.
That isn’t the case this time. This again could mean that this isn’t Bitcoin’s true rally and more ATH may be incoming at a later time. Keeping an eye out for the IV v. RV charts and their possible crossovers might change the game for BTC yet again.


