This can spur a move to a fresh ATH for LUNA

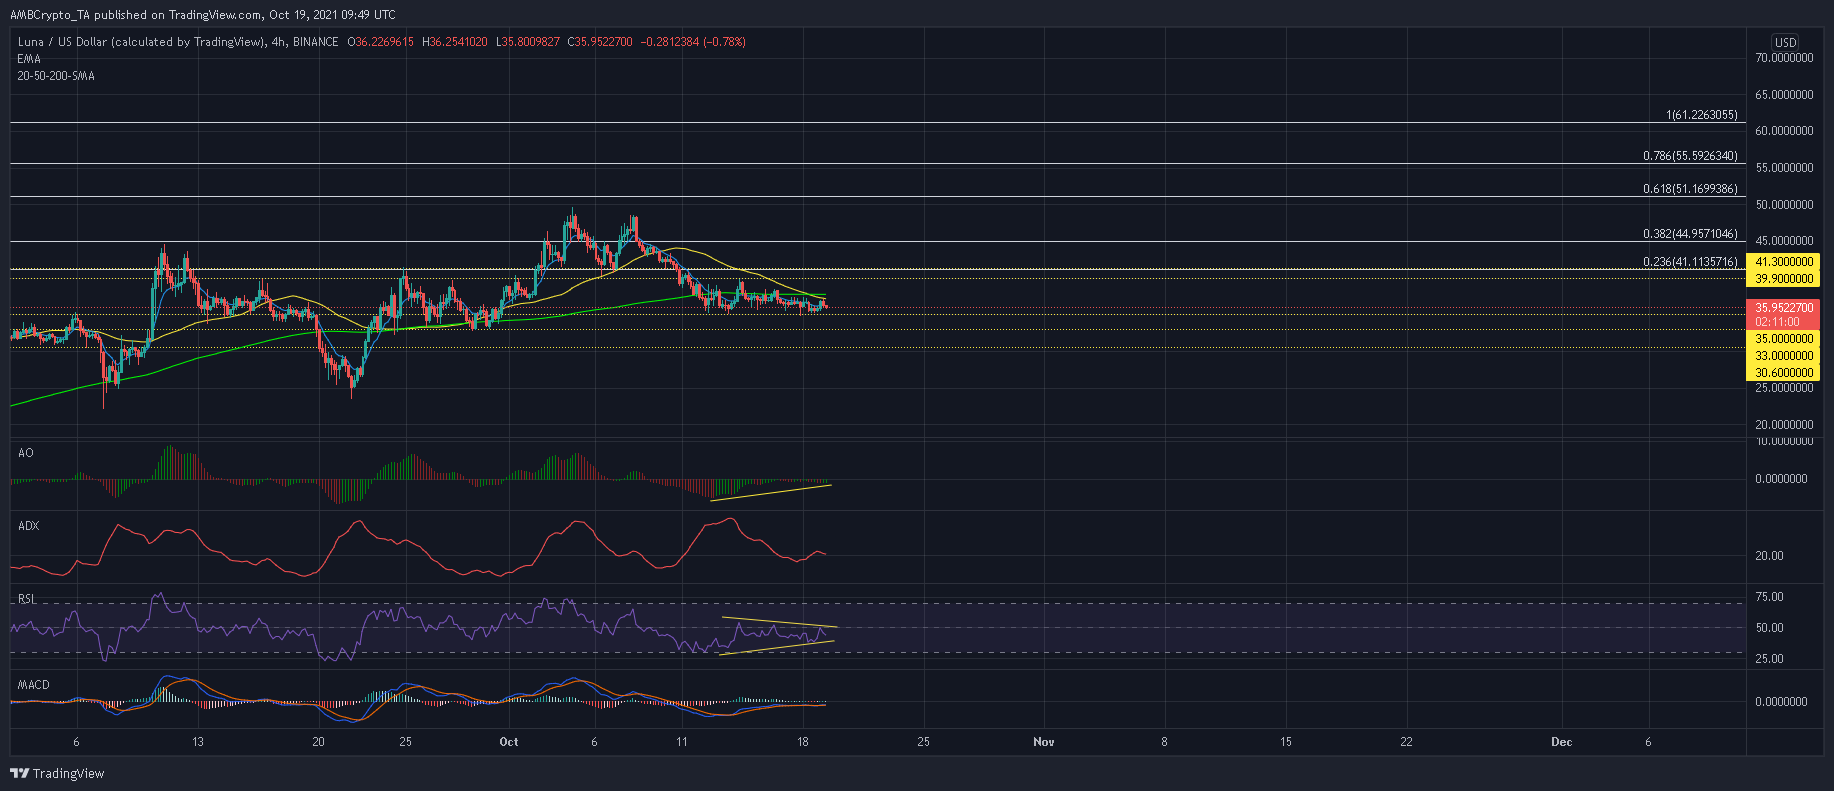
Since last week, LUNA maintained its consolidatory phase, trading within the tight channel of $40-$35. However, bulls have been paving way for an upwards breakout- a finding backed by bullish divergences along the RSI, MACD and Awesome Oscillator.
Market observers should keep an eye out for a close above the confluence of the 200-SMA and 50-SMA as LUNA looks to embark to a new ATH. At the time of writing, LUNA traded at $35.9, down by 0.4% over the last 24 hours.
LUNA 4-hour Chart
LUNA’s price was left reeling after a double top around $48.8 triggered a near 30% decline from record levels. Over the near-term, a bearish crossover between the 50-SMA (yellow) and 200-SMA (green) could keep LUNA restricted between the $33-$35 range.
Defensive resources for LUNA were also present at $30.6 in case broader market pairs gains before Bitcoin’s jump to a new ATH. Should bulls generate solid momentum above $39.9-$41.3, LUNA would be in a prime position to snap a new ATH, provided bulls are able to overcome a triple top at $48.8.
The 61.8%, 78.6% and 100% Fibonacci Extension levels could be LUNA’s destination over the course of the next few weeks.
Reasoning
Now bulls were making good progress in the market despite LUNA’s rangebound behavior. The Awesome Oscillator eyed a move above the half-line on the back of a bullish twin peak, while the MACD was inching steadily towards its equilibrium mark. Finally, the RSI traded within a symmetrical triangle, which could transpire into massive upswing for LUNA.
Conclusion
The indicators suggested that LUNA was well within a bullish-bias even after taking its recent losses into consideration. However, LUNA could continue to trade sideways as spot volumes remain low across exchanges. A weak ADX also lent weight to this weak near-term outlook. Once volumes start to pickup, a move above the 50-SMA and 200-SMA could spur a fresh ATH on the chart.


