Analysis

This indicates XRP may have bottomed out, will it stretch as far as $1.2
Posted:
| Last updated: January 30th, 2024
Journalist

XRP climbed rapidly over the past few days and met with resistance at the $1 mark. $1 was a round number resistance level and an area of supply. Rejection in this area and a retest of the $0.886 level would likely be a buying opportunity, targeting the $1.1 liquidity cluster.
However, even though Bitcoin is above $50k once more, the area from $50k-$54k was full of resistance, and BTC might not be able to break past it in one go.
XRP
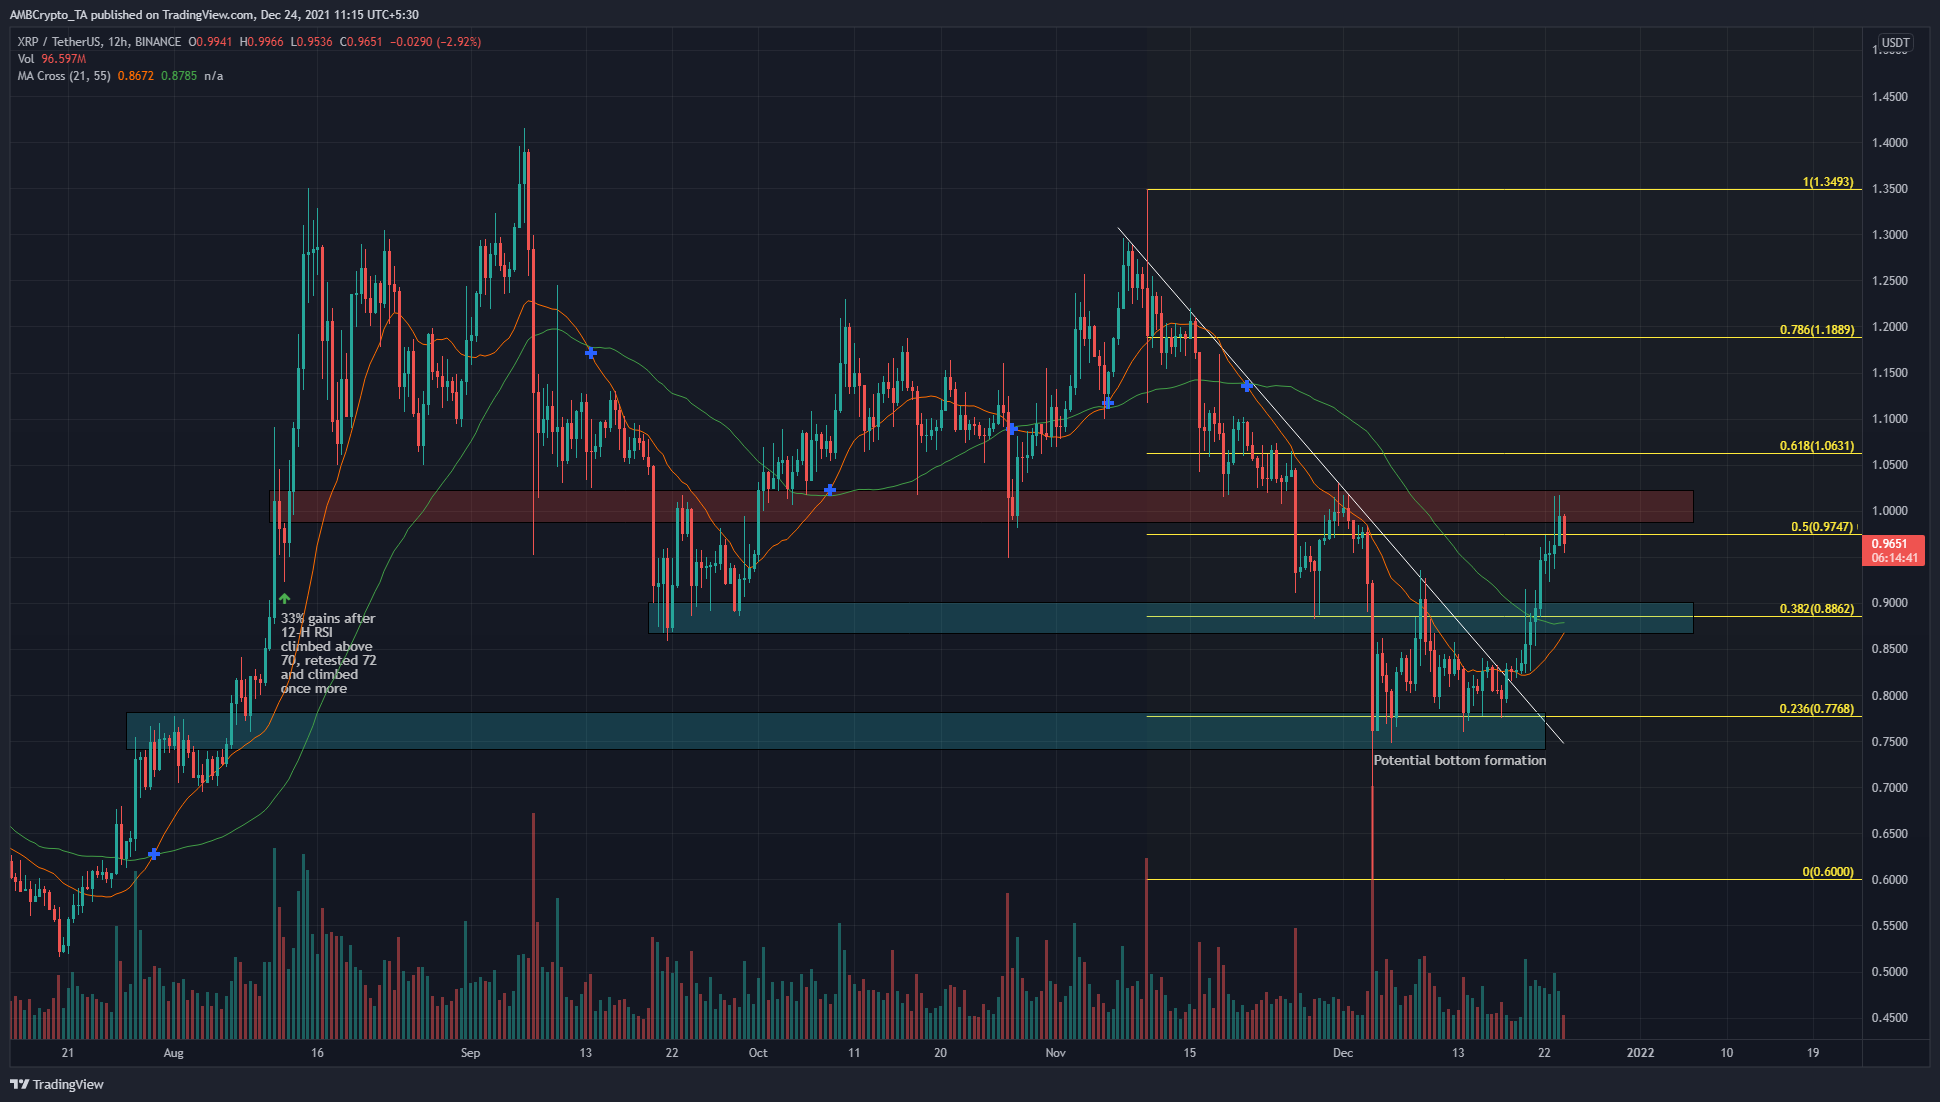
Source: XRP/USDT on TradingView
XRP climbed above a trendline resistance (white) that had been in play since early November. Before the breakout, XRP repeatedly tested the $0.75 area (lower cyan box) for buyers. This area was an area that XRP was expected to find demand in, based on price action from August.
Plotting Fibonacci retracement levels for XRP’s most recent swing highs and lows, we can see that this demand area also had confluence with the 23.6% retracement level at $0.776. The upper cyan box, another area of importance over the past few months, had confluence with the 38.2% retracement level.
The 21 SMA (orange) and 55 SMA (green) were on the verge of forming a bullish crossover, again at the $0.886 area. This crossover, if it occurred, would further highlight the area as significant support.
Rationale
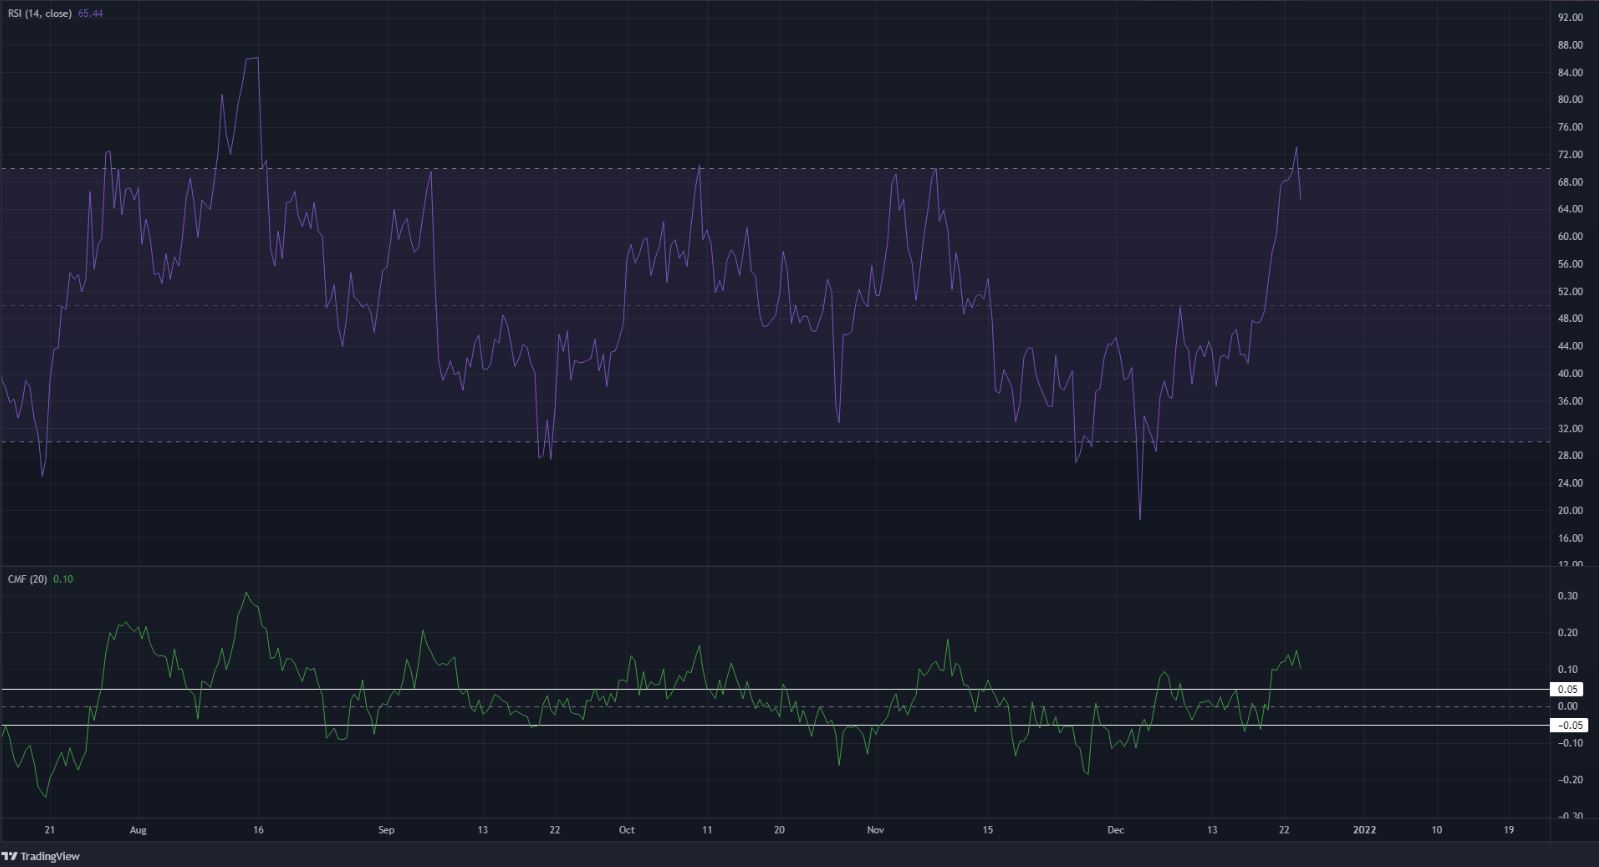
Source: XRP/USDT on TradingView
Price seeks liquidity, and the move to $1 was met with a wall of sellers. The $0.886 area represented the next area of strong liquidity where buyers would likely step in. The Chaikin Money Flow was above +0.05 and indicated capital flow into the market.
The RSI was rejected near the 70 level. Previously, a move past 70 and a retest of 72 saw XRP gain around 33% within a few days in August. Hence, RSI climbing above 70 was another thing to look out for.
Conclusion
Areas of supply and demand were highlighted to be at $1 and $0.886 respectively. While a retest followed by a strong move up to $1.1 looked likely on the price chart for XRP, BTC remained a critical factor as well. BTC was bullish on lower time frames but resistances overhead remain, which may not be conquered by bulls on one try.
Hence, XRP’s retest of $0.886 was likely to be followed by a move to $1 once more and possibly as high as the $1.05-$1.1 area. If the 12H RSI flips the 70 mark, further gains could be possible.