This is when the XRP will reach crucial $1 mark

XRP steeply reversed in a down-channel (white) on its daily chart after poking its nine-month resistance at the $1.3-mark. With this fall, it fell below its EMA ribbons while flipping the 200 EMA (cyan) from its support to immediate resistance.
A convincing close above the $0.87-resistance and the 200 EMA would confirm a reversal of the long-term bearish trend. And with it, the possibility of the alt touching the $1-mark. At press time, XRP traded at $0.8321, up by 8.2% in the last 24-hours.
XRP Daily Chart
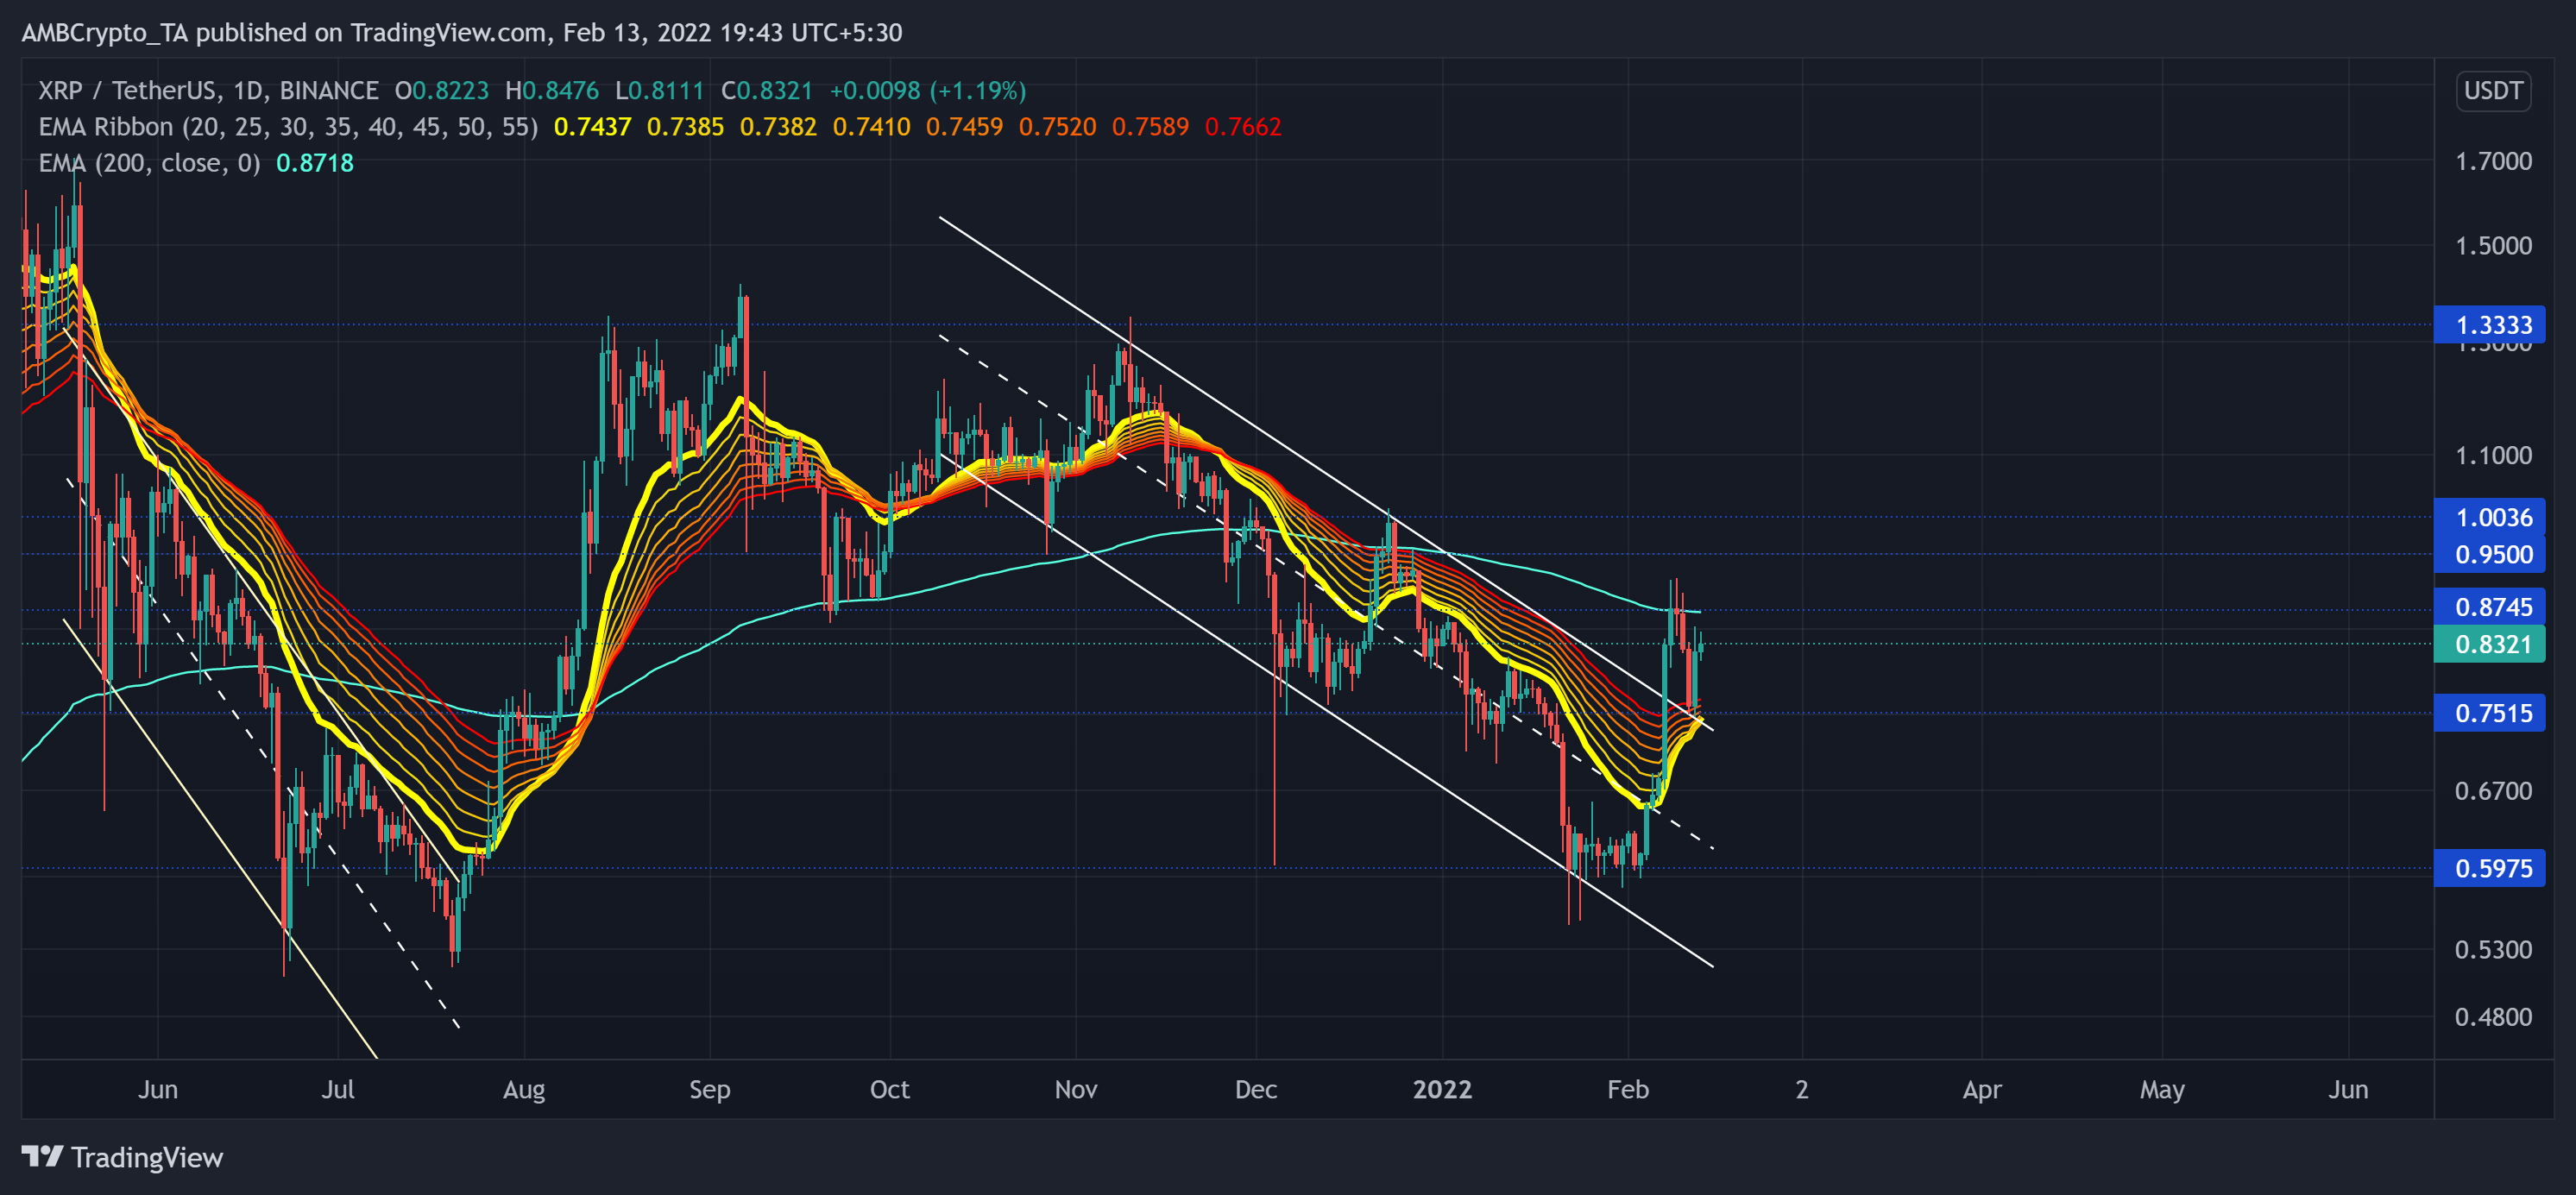
As it descended between a down-channel, the alt retraced by nearly 60% (from 10 November) as it plunged towards its six-month low on 22 January.
As a result, the price action fell below all its EMA ribbons, affirming the bearish edge. However, XRP registered a 41.82% ROI in just the last 11 days. Thus, breaking out of the pattern and retesting the crucial $0.87-resistance. This level also coincided with the 200 EMA.
Now, as the 20 EMA jumped above the 25-30-35 EMA, the EMA ribbons endeavored to make a bullish flip. XRP saw a similar trajectory in July 2021, wherein a down-channel breakout tested the 200 EMA multiple times before entering into price discovery. The coming days will reveal whether it repeats history or not.
The bulls eyed to test the 200 EMA in the coming days while gathering thrust to sustain a possible breakout. Any close above the $0.87-level would propel the alt to test the $0.95-mark followed by the $1-level, depending on the intensity deployed by the bulls. On the flip side, should the market sentiment worsen, it could find testing grounds at the $0.75-level.
Rationale
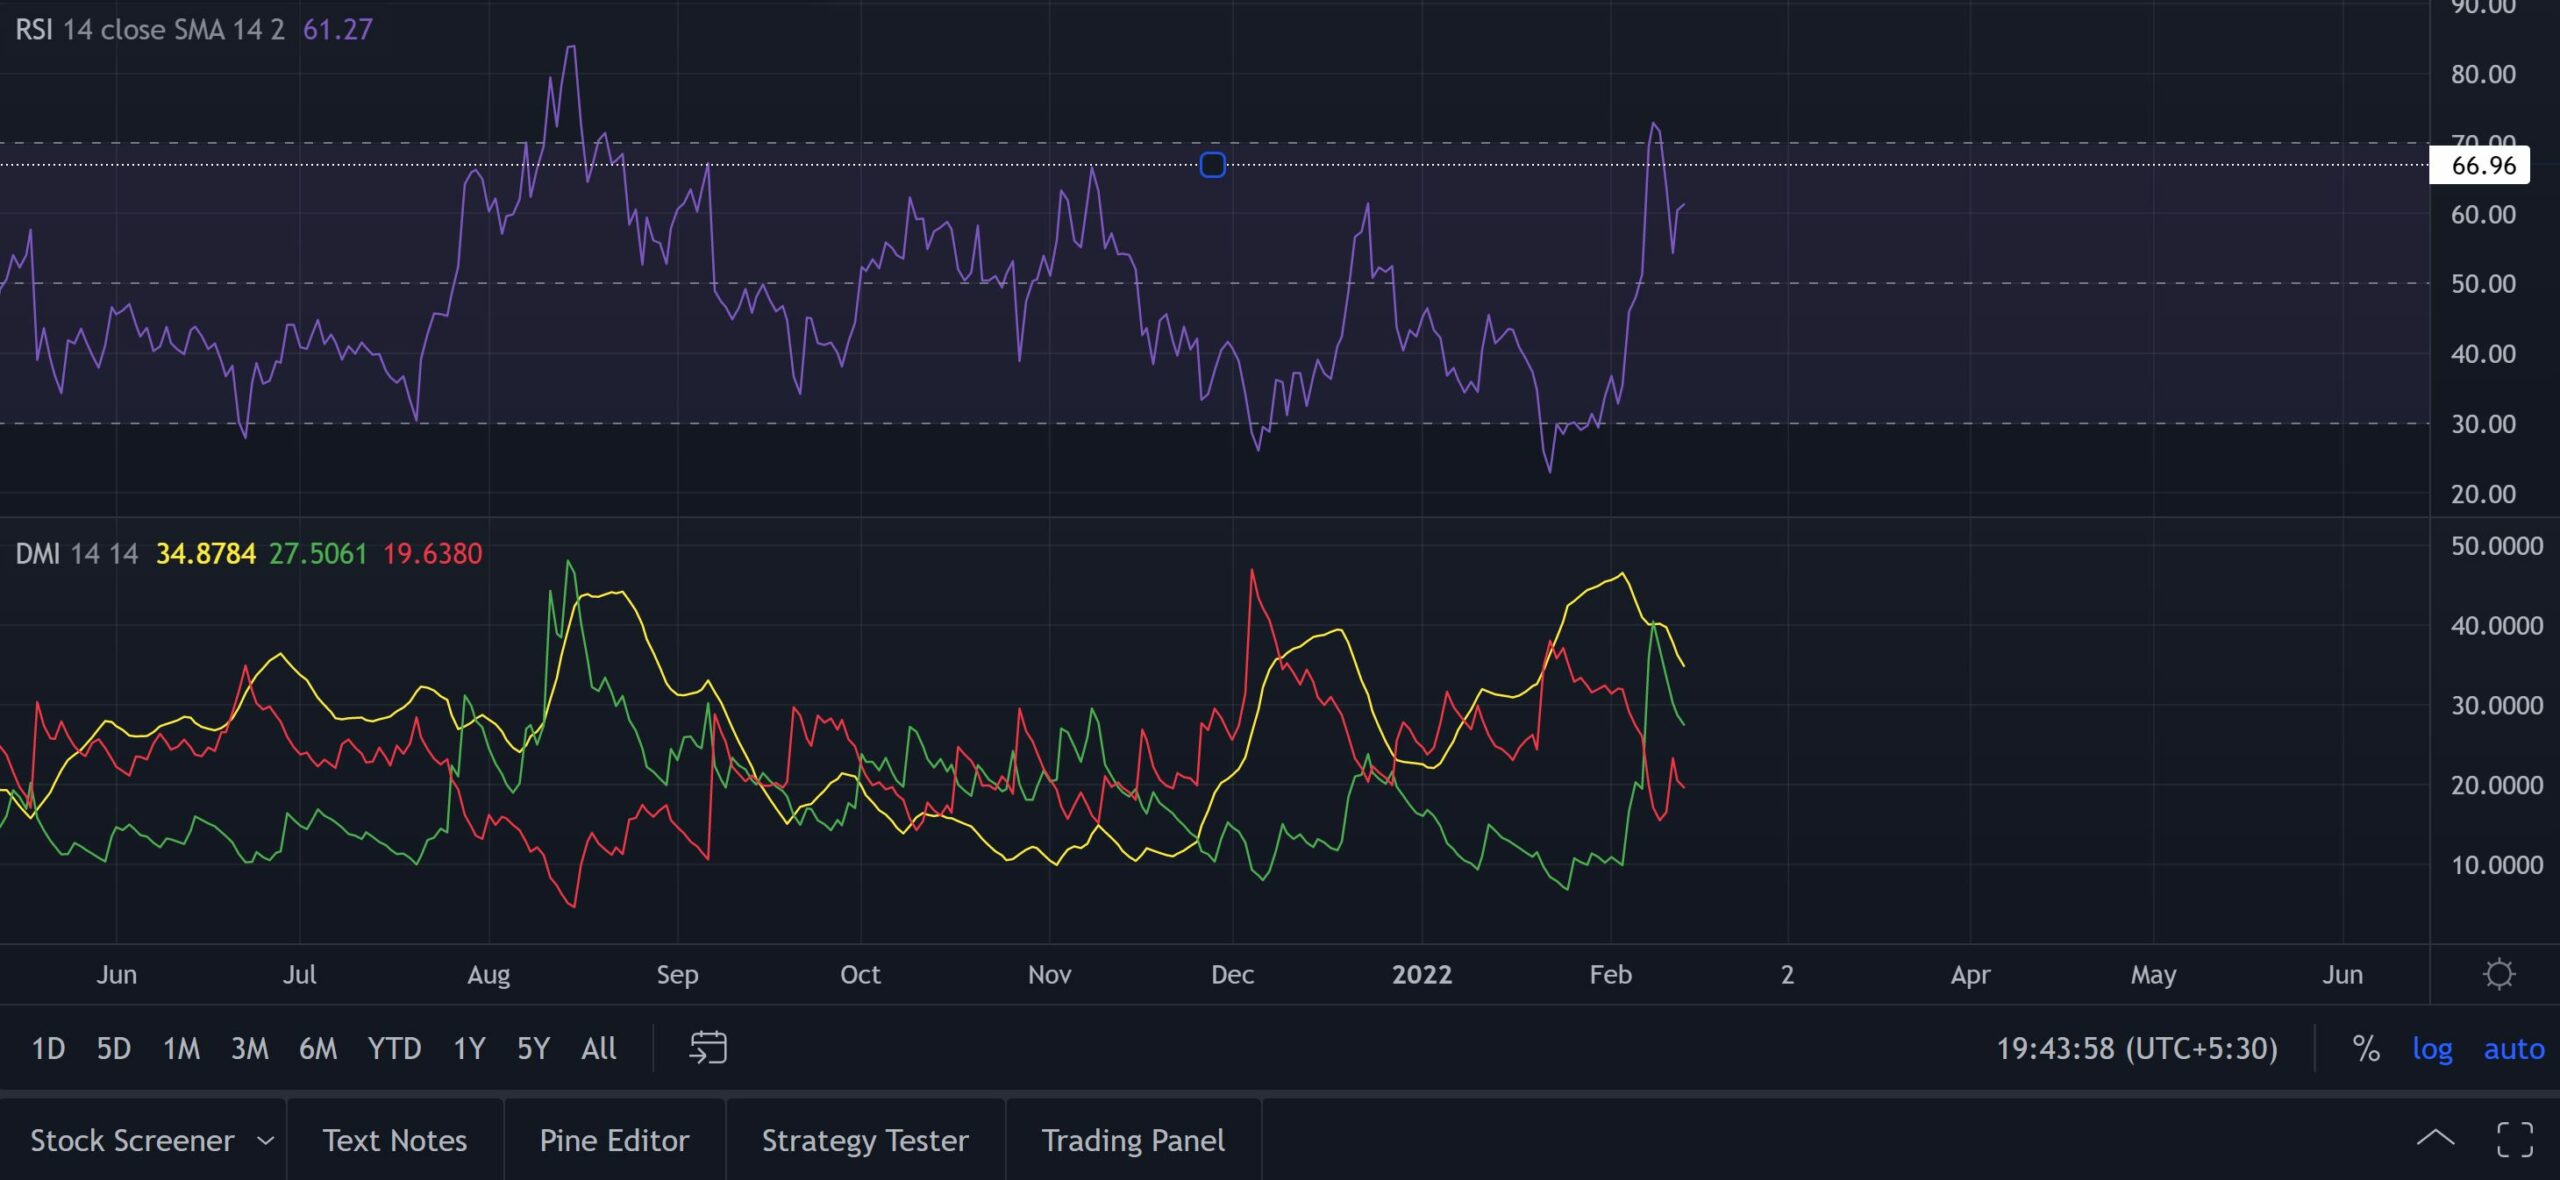
The RSI was northbound after witnessing staggering gains and swaying above the equilibrium as it eyed to test the 63-mark. Any close above this level would brighten the chances of toppling the 200 EMA.
Also, the DMI lines projected a bullish edge. But as the +DI still did not look north, a low volatility phase should not be a surprise.
Conclusion
The $0.87-level would be a crucial price point for igniting a possible price recovery toward the $1-mark. With the technical indicators favoring the buyers, the resurgence of the bullish sentiment seemed likely. Having said that, keeping an eye on Bitcoin’s movement would be important to complement the above analysis.


