Traders beware! Ethereum is very likely to drop all the way to…

Disclaimer: The findings of the following analysis are the sole opinions of the writer and should not be taken as investment advice
The level above $3,300 has held firm in response to Ethereum’s steady uptrend. A failed breakout attempt, at press time, seemed to be transpiring into a fourth straight red candle on Ethereum’s chart. This was something last seen over a month ago. A few more risks were present in the form of an ascending channel breakdown and sell signals on some of ETH’s indicators.
At the time of writing, ETH was trading at $3,121, down by 6% over the last 24 hours.
Ethereum 12-hour chart
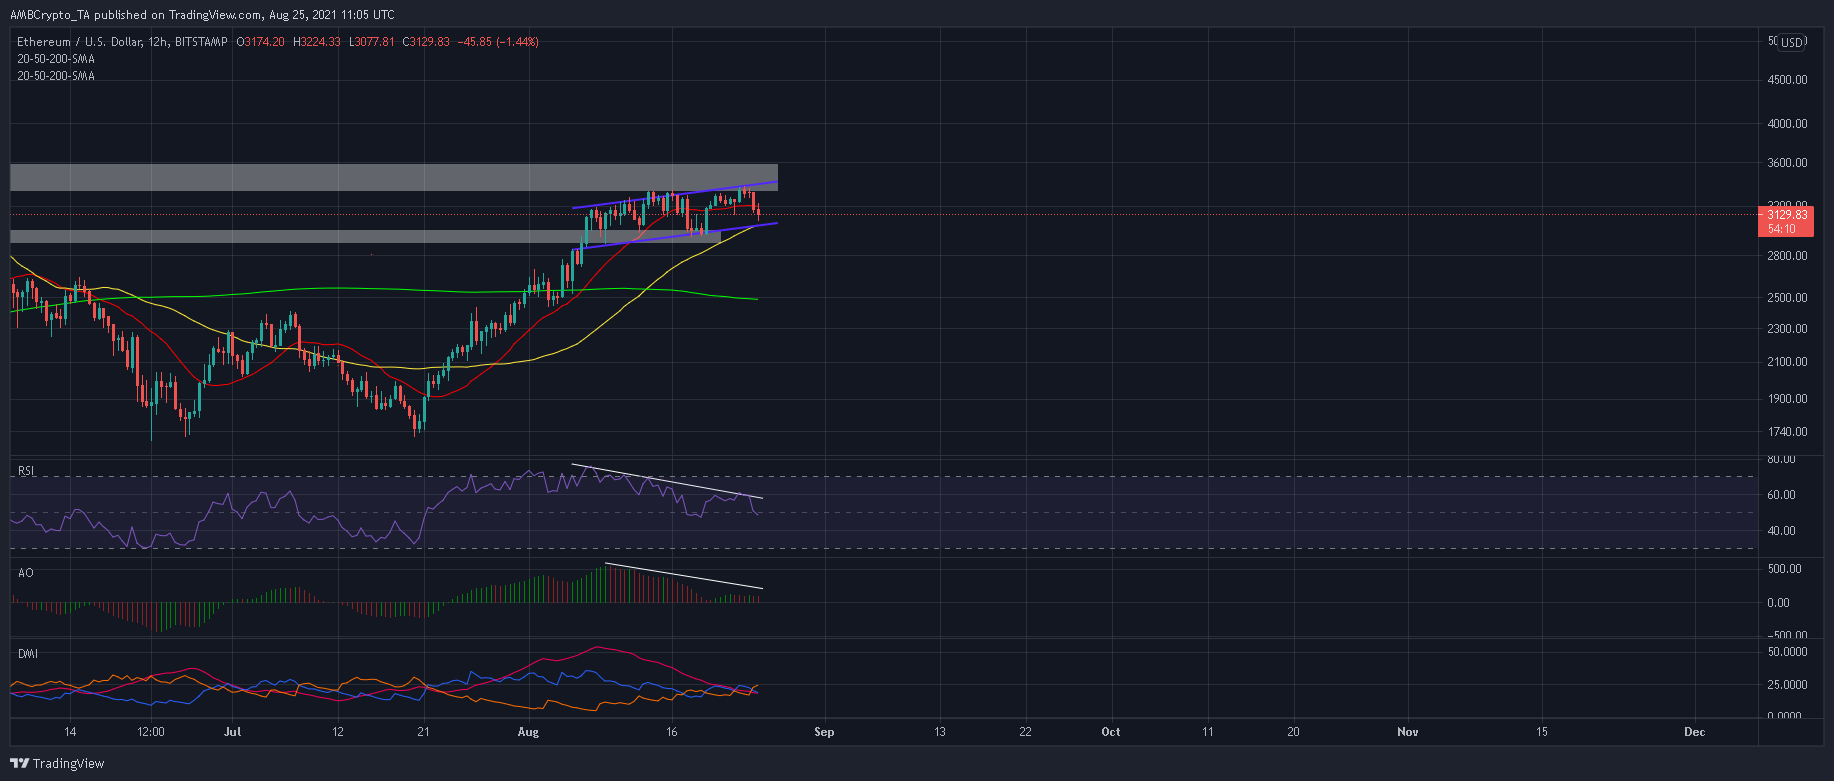
While ETH has maintained its position within a steady uptrend since late July, the 12-hour chart highlighted some vulnerabilities. ETH has traded within an up-channel since early August, but the lower range of $3,400-3,600 is yet to be toppled. Spotlight now falls on the lower trendline once again and the 50-SMA (yellow), both of which have the potential to deny an extended decline.
If selling pressure is not contained above $2,900, another breakdown would be in effect. This would invite additional short-sellers. The cut-off for mid-term bullish control would be around the $2,700 price level from where the 200-SMA (green) would be in focus.
Reasoning
The RSI formed lower highs and identified bearish divergences with respect to ETH’s price action. This was a major warning sign which presented chances of a severe pullback in price. A move below 45-40 and into bearish territory would confirm an unfavorable outcome for ETH.
Lower peaks were also observed on the Awesome Oscillator – A finding which implied that bullish momentum had exhausted itself. This put the Directional Movement Index under a lot of pressure. The indicator was struggling to identify a clear market trend as the +DI line was intertwined with the -DI line.
Conclusion
Another 10% drawdown seemed possible for ETH if buyers fail to react immediately to selling pressure. To reverse a bearish projection, ETH must sustain itself above the 50-SMA and avoid a close below $2,900.
If the market does play out in an unfavorable manner, it is likely that ETH would drop all the way towards $2,700 before buyers offer a comeback. Meanwhile, the market posed more risks for bullish traders and shorting ETH in case the alt closes below a critical price level would be a better call.