Tron, Aave, VeChain Price Analysis: 20 December

Tron dipped as far south as $0.027 two weeks ago, but it has recovered since after posting steady gains as the market’s bulls reclaimed the important $0.03-level from the market’s bears. Aave faced a ceiling around the $94-mark and VeChain formed an ascending triangle pattern that could see a bullish breakout.
Tron [TRX]
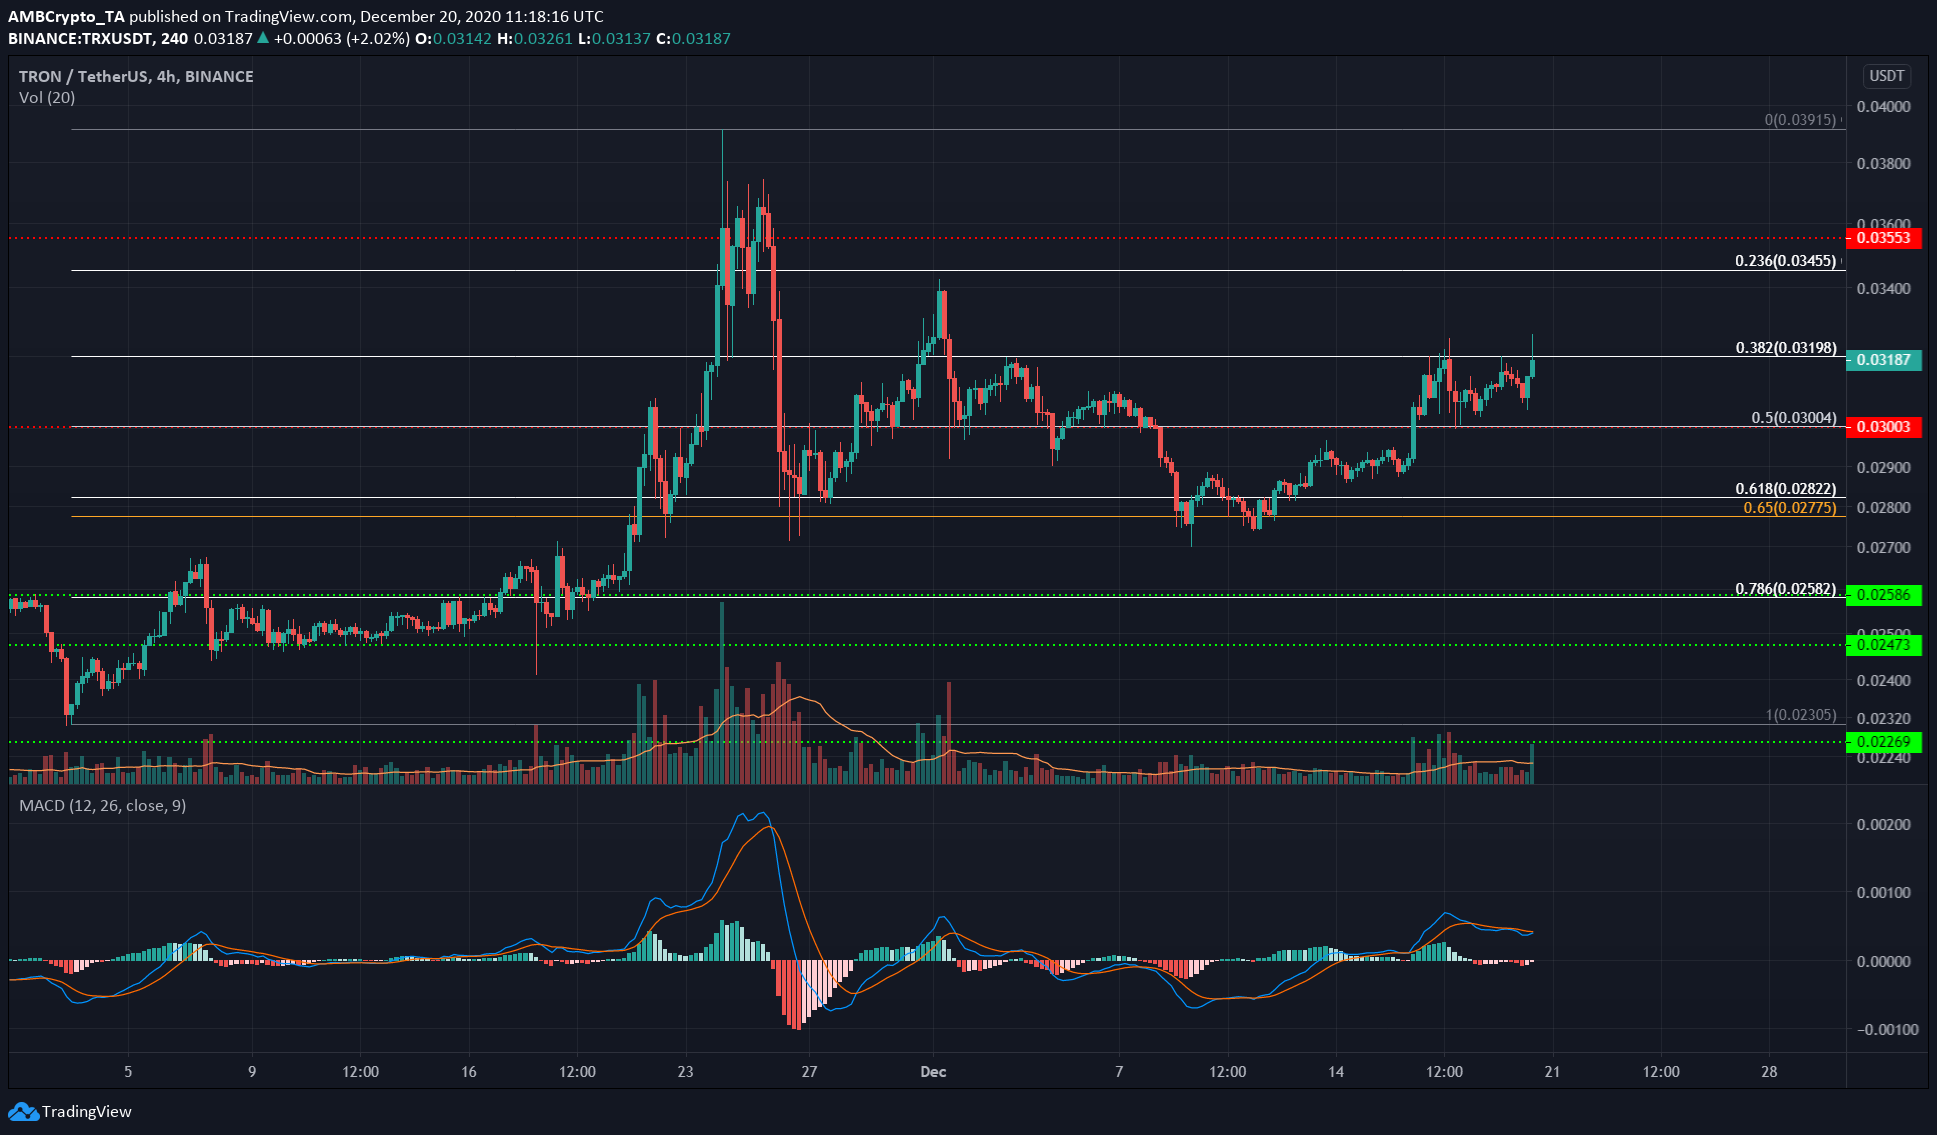
The most recent trading session for TRX tested the 38.2% Fibonacci retracement level at $0.032 and pushed past it, but selling pressure forced the price back under the level.
The MACD noted neutral momentum behind TRX, with the price spending the past few days caught in a range between $0.03 and $0.032.
A close outside either boundary is necessary for the next move, and since the $0.03-level has been reclaimed by the market’s bulls recently, further upside could be on the cards.
This scenario could play out with TRX rising past $0.032, retesting it as support, and forging upwards once again over the next few days, something that could be a trigger to open long positions.
Aave [AAVE]
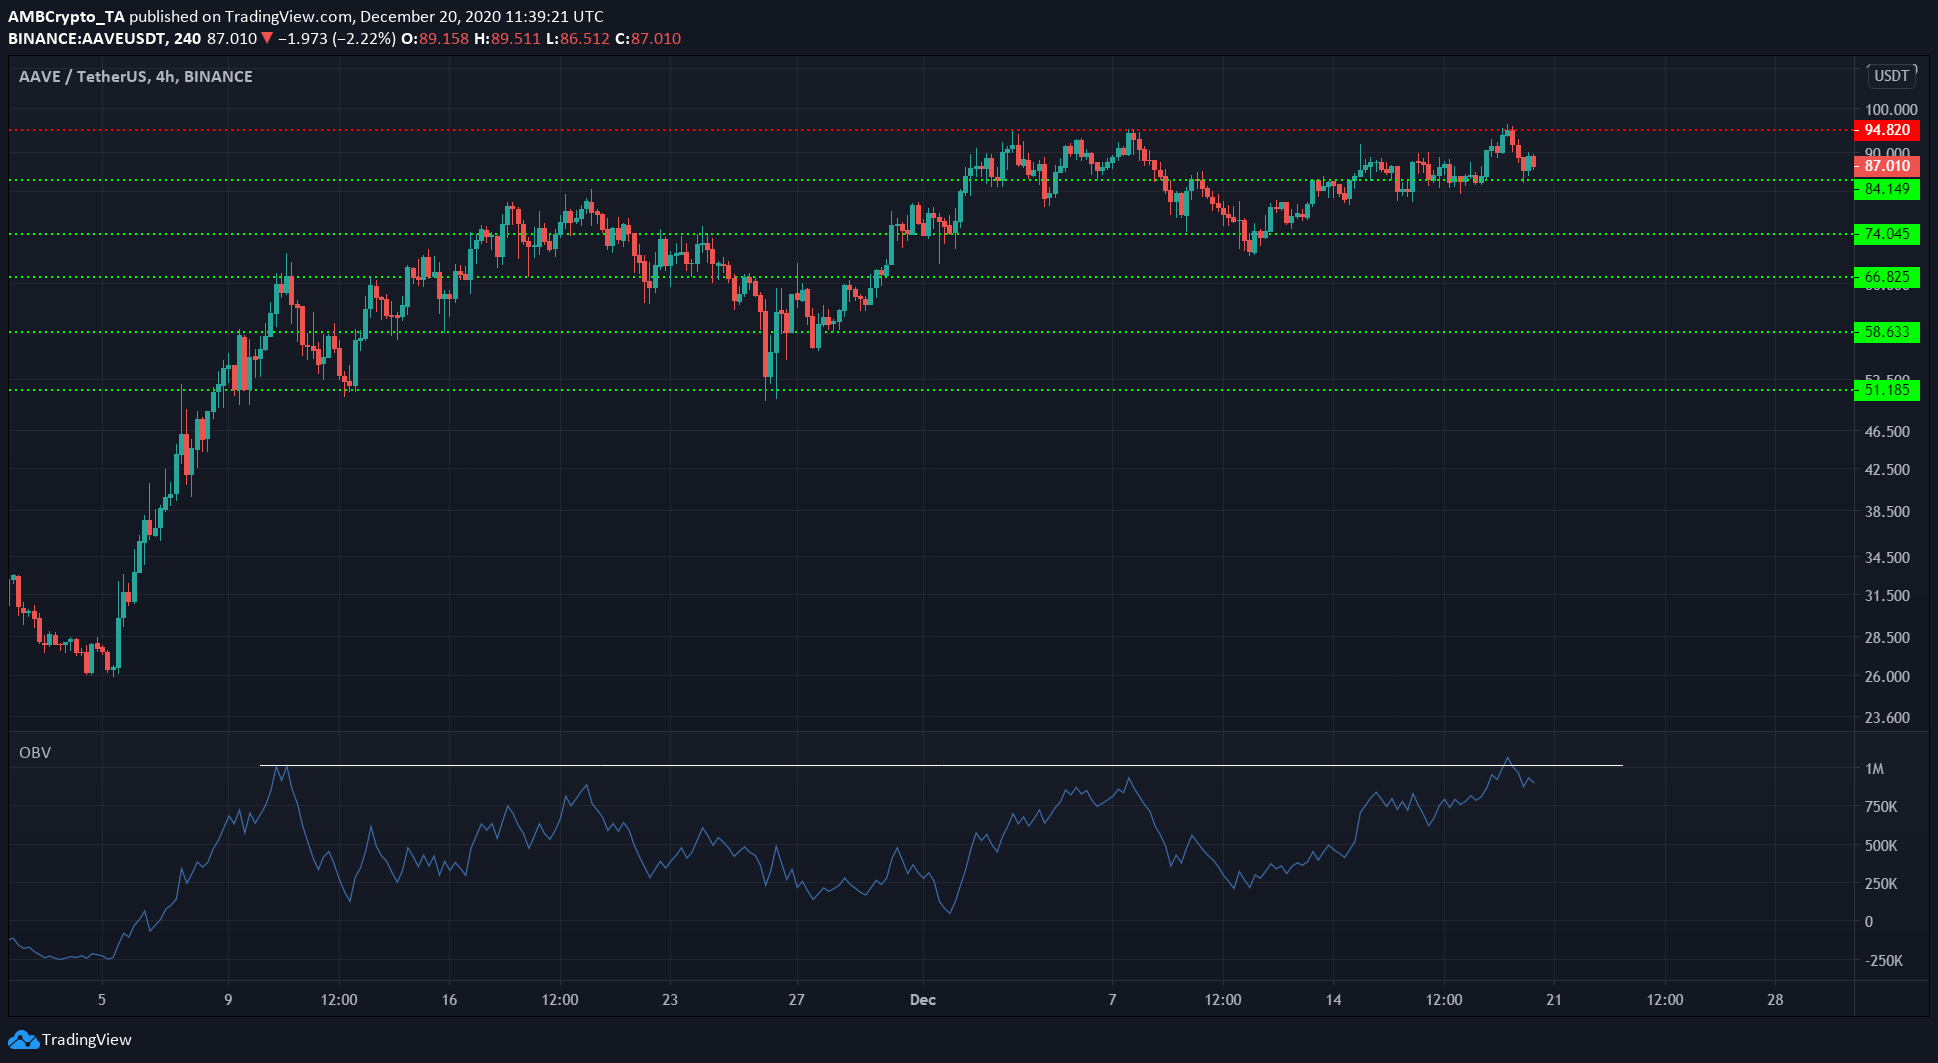
Aave has been on a steady uptrend lately, having seen healthy pullbacks from the $94-resistance all the way to the $74-support. In fact, it was recently rejected at the $94-resistance once more.
The OBV showed that buying volume was rising over the past week, even as AAVE failed to breach the level of resistance above. This was a bullish indication for the price. And yet, no higher highs have been set since early November, something that pointed to a possible lack of buyers.
Timing is extremely important when trading the markets. Based on the evidence at hand, a safe option would be to open a long position when $94 is flipped to support or wait for a 4-hour or longer timeframe bearish divergence to develop before attempting a scalp short near that level of resistance.
Above $94, only the psychological $100-resistance level exists.
VeChain [VET]
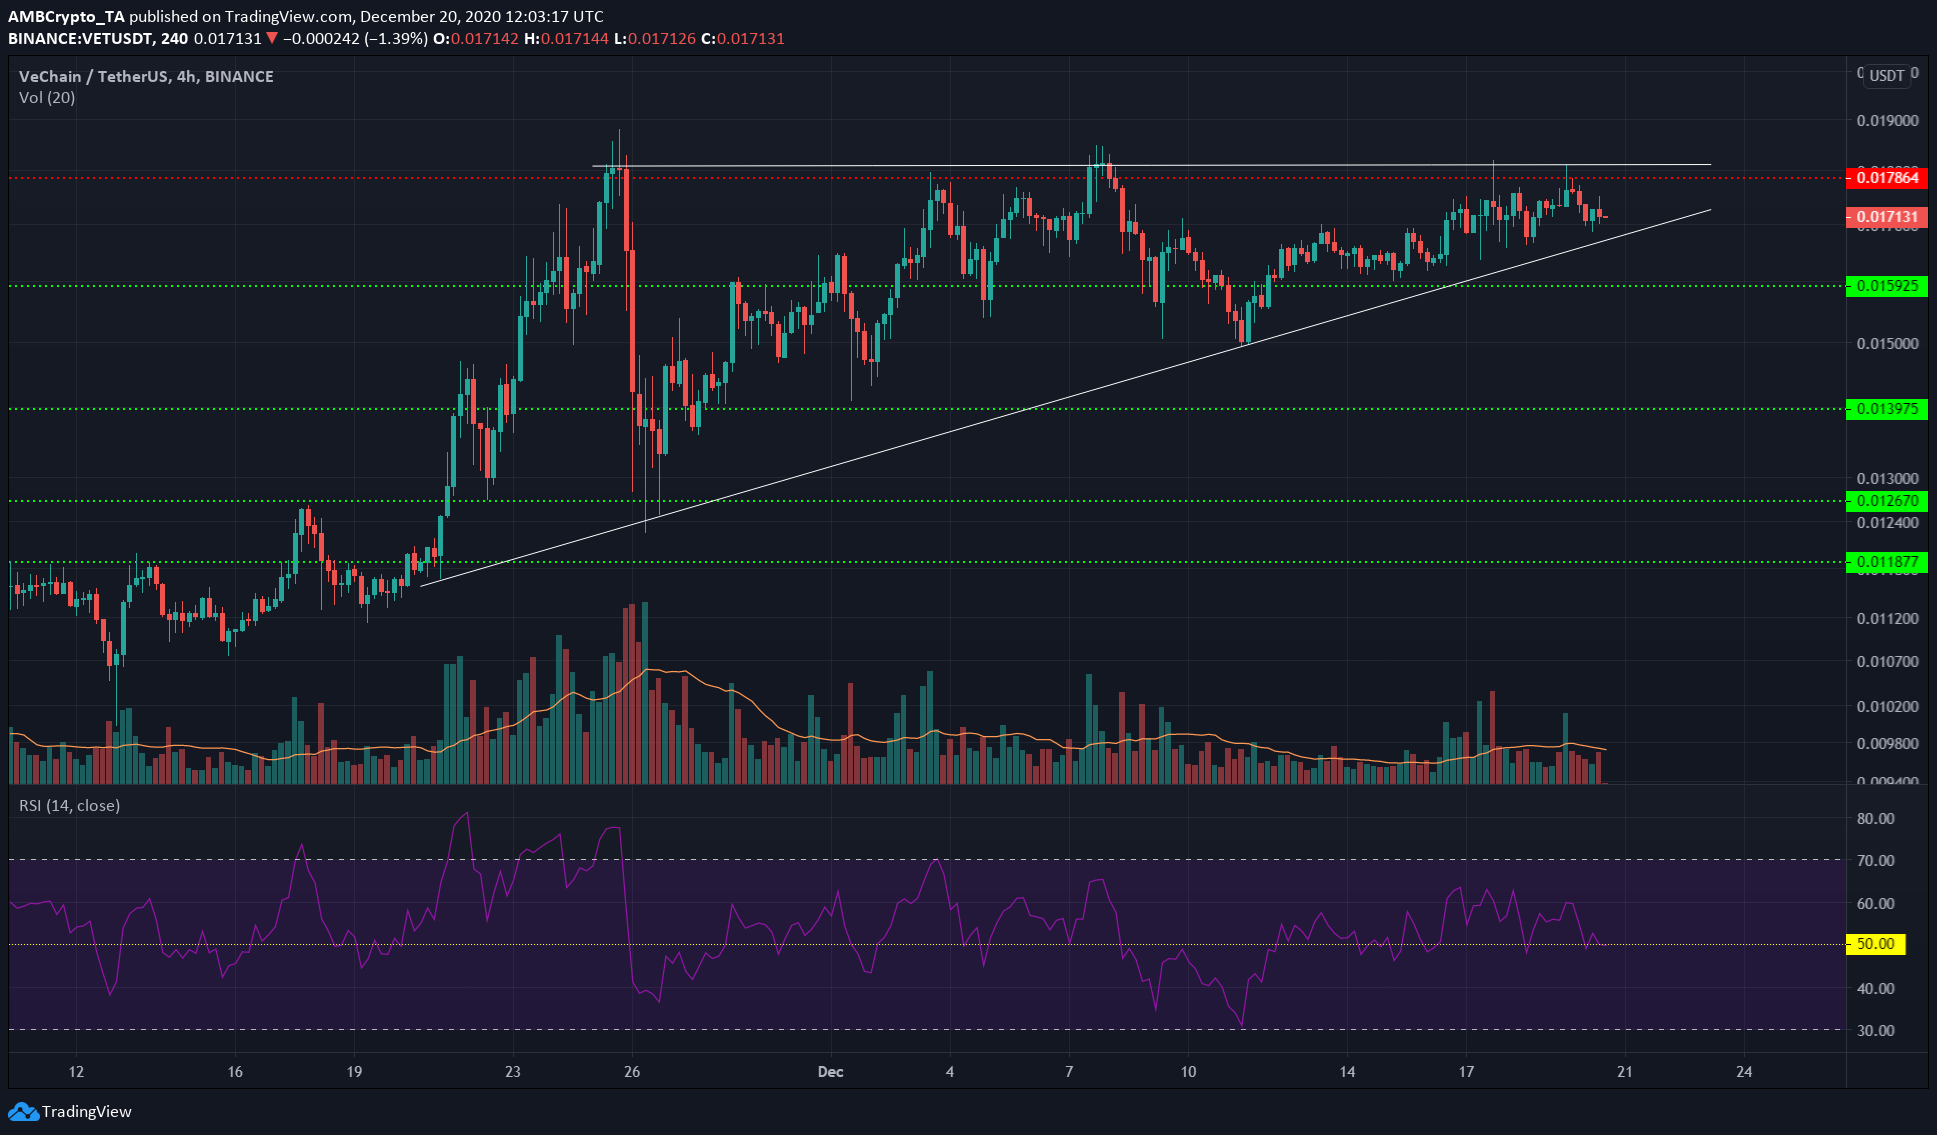
There has been persistent selling pressure around the $0.018-region for VET. The price formed an ascending triangle pattern on the charts, a pattern that generally sees a breakout to the upside.
A close outside the triangle would indicate the next direction for the market. At the time of writing, the RSI was around 50. A close below $0.0168 could see both the RSI and the price plummet.
A strong move backed by good trading volume would best indicate the direction of a breakout, and trades can be placed based on this confirmation.


